This instrument is for subscribers only.
As a subscriber you get access to all instruments.
As a subscriber you will regularly receive selected trading and investment opportunities.
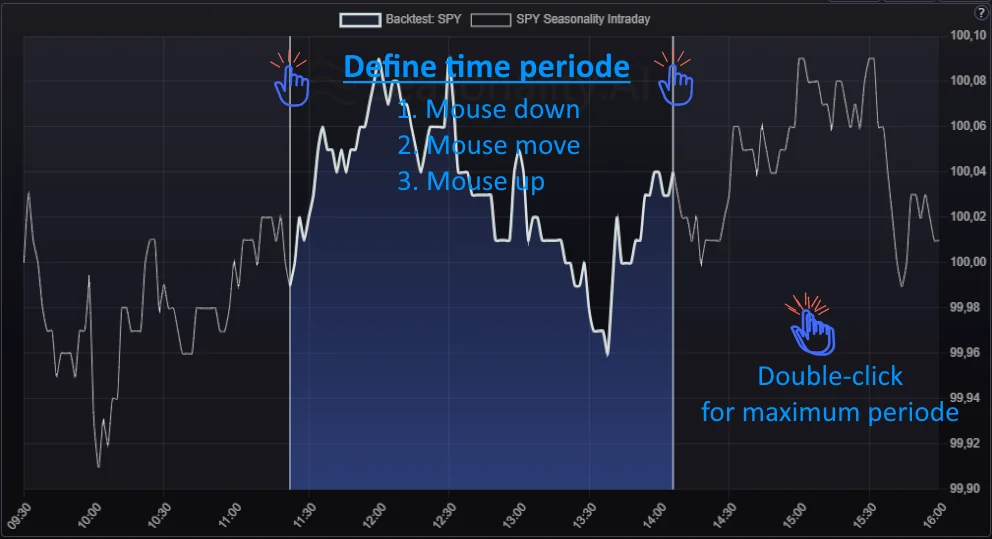
The seasonal chart shows the average intraday price trend for the selected history.
Backtest Result Key figures:
Summarized profit: Profit of the selected period of all calculated trades.
Winning trades: Percentage number of positive trades.
Average profit: Average profit of the selected period of all calculated trades.
Max drawdown: Maximum loss period in the summarized profit.
Sharp ratio: The sharp ratio shows the quality of the summarized profit in terms of profit and drawdown.
Sortino ratio: The sortino ratio shows the quality of the summarized profit in terms of profit and drawdown. The Sortino Ratio is the preferred metric for us because it does not negatively factor in positive volatility.
Count trades: Number of trades.
Gains / Losses: The number of trades won and lost.
0 %
Pre event intraday backtest: Intraday backtest for the time before the event time.
If the event time is before the start of regular trading hours, this backtest is not created.
Backtest Result Key figures:
Max drawdown: Maximum loss period in the summarized profit.
Summarized profit: Profit of the selected period of all calculated years.
Sharp ratio: The sharp ratio shows the quality of the summarized profit in terms of profit and drawdown.
Sortino ratio: The sortino ratio shows the quality of the summarized profit in terms of profit and drawdown. The Sortino Ratio is the preferred metric because it does not negatively factor in positive volatility.
Count trades: Number of trades.
Improvement: The ratio shows how much the seasonal trend has improved from half of the selected period. A high number is a positive sign.
Backtest Result Key figures:
Average profit: Average profit of the selected period of all calculated trades.
Winning trades: Percentage number of positive trades.
Gains / Losses: The number of trades won and lost.
Last trade: Max drawdown: The maximum loss of the last trade that occurred during the holding period but was not realized.
Last trade: Profit: The Profit of the last trade.
Intraday-Trade simulation of the selected event day (Trade List)
Intraday-Trade list: The trading list shows the trades simulated by the two intraday backtests.
Intraday-Trade list: The trading list shows the trades simulated by the two intraday backtests.
| Symbol | Startdate | Startprice | Enddate | Endprice | Change | Change % | Maxrise % | Maxdrop % |
|---|
The seasonal chart shows the average intraday price trend for one week.
Seasonal Statistics: The following three charts show the seasonal evaluation for each hour, each day of the month and each day of the week.
Hourly Seasonality: The chart shows the hourly seasonal trend for the selected period.
Month-day Seasonality: The chart shows the seasonal trend for each day of the month.
Weekdays Seasonality: The chart shows the seasonal progression for each day of the week.
Hourly Statistic: The statistics show the average hourly performance and the percentage win rate. The best and the worst hours are displayed, including the days when they occurred.
| Jan. | Feb. | Mar. | Apr. | May. | June | July | Aug. | Sep. | Oct. | Nov. | Dec. |
|---|


