This option enables a weighted annual calculation of seasonal patterns. Older data (price movements) are multiplied by a value smaller than 1 and receive a lower significance in the overall calculation. This makes it easier to identify seasonal trends that have weakened in recent years.
-
All values from the last 2.5 years: * 1.5
-
All values older than 2.5 years: * 1.35
-
All values older than 5 years: * 1.25
-
All values older than 7.5 years: * 1
-
All values older than 10 years: * 0.8
-
All values older than 12.5 years: * 0.65
-
All values older than 15 years: * 0.45
The weighted annual calculation does not have any effect on the price list or the profit and loss trades.

This instrument is for members only.
As a member you get access to all instruments.
Furthermore, as a member you have full access to our powerful Screener and Seasonality Analyses Tool.
The combination of the tools makes recurring patterns (seasonality) so valuable.
As a member you will regularly receive selected trading and investment opportunities.
Hundreds of very good entry and exit points are stored in our database.
Use our screener to take full advantage of the potential of recurring patterns.
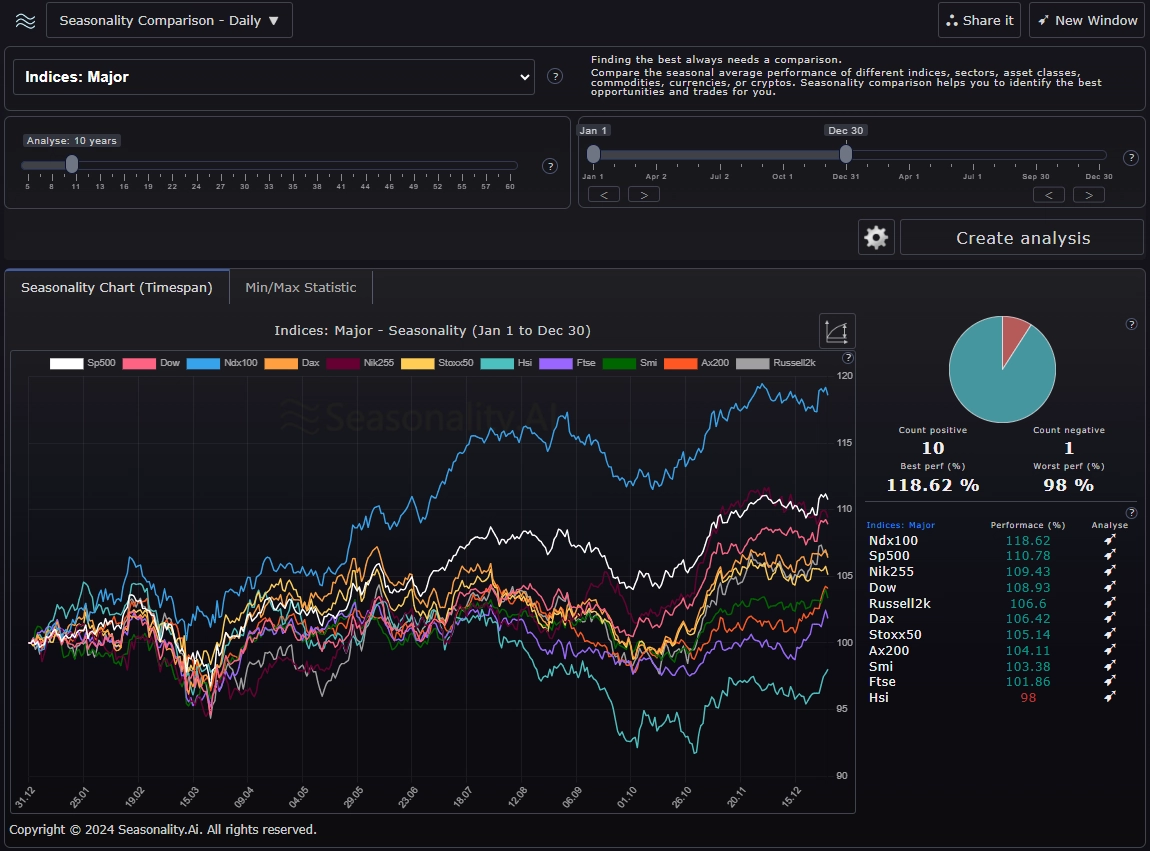
Seasonality Chart: The chart shows the seasonal development of the instrument bundle in the selected period.
Analysis - Result Key figures:
Count positive/negative: Number of instruments that end the analysis period with a positive or negative result.
Best/Worst performance (%): The seasonal pattern's best and worst percentage development.
Symbols - Performance (%):
List of individual instruments and their percentage development of the seasonal pattern.
You can perform a detailed analysis of the selected instrument using the arrow in the 'Analyse' column.
Min/Max Statistic: The tab shows each instrument's best and worst performance and the corresponding year.
Performance: Percentage development of the seasonal pattern.
Gain Hit Ratio: How often has the instrument performed positively in the selected period?
Max Return: Best percentage performance of the instrument in the selected period.
Max Year: The year of the best percentage performance of the instrument in the selected period.
Min Return: Worst percentage performance of the instrument in the selected period.
Min Year: The year of the worst percentage performance of the instrument in the selected period.
Analyse: Open the Seasonality Chart Analyser with the respective instrument.