Finding the best always needs a comparison.
Compare the seasonal average performance of different indices, sectors, asset classes, commodities, currencies, or cryptos.
Seasonality comparison helps you to identify the best opportunities and trades for you.
Exclude month days:
Exclude week days:

This instrument is for members only.
As a member you get access to all instruments.
Furthermore, as a member you have full access to our powerful Screener and Seasonality Analyses Tool.
The combination of the tools makes recurring patterns (seasonality) so valuable.
As a member you will regularly receive selected trading and investment opportunities.
Hundreds of very good entry and exit points are stored in our database.
Use our screener to take full advantage of the potential of recurring patterns.
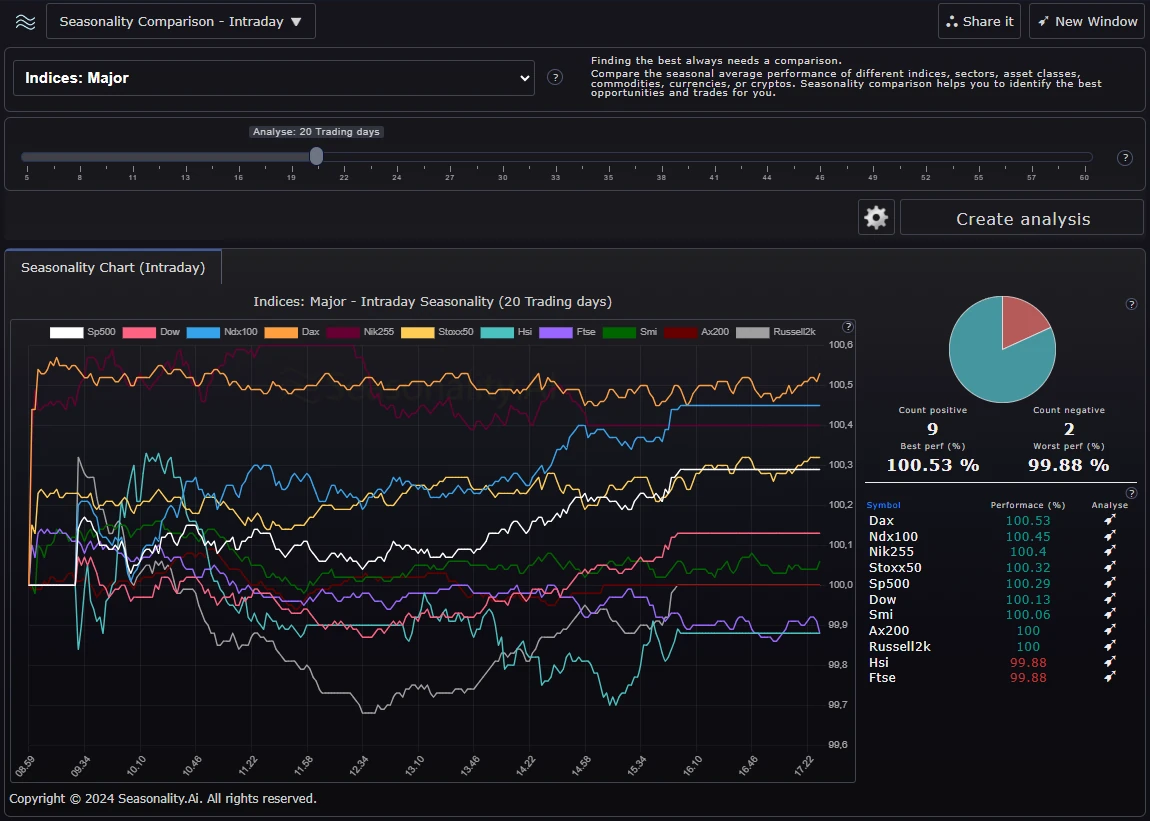
Intraday Seasonality
Intraday Seasonality Chart: The chart shows the intraday seasonal development of the instrument bundle in the selected period.
Analysis - Result Key figures:
Count positive/negative: Number of instruments that end the analysis period with a positive or negative result.
Best/Worst performance (%): The seasonal pattern's best and worst percentage development.
Count positive
Count negative
0
0
Best perf (%)
Worst perf (%)
0 %
0 %
Symbols - Performance (%):
List of individual instruments and their percentage development of the seasonal pattern.
You can perform a detailed analysis of the selected instrument using the arrow in the 'Analyse' column.
Symbol
Performace (%)
Analyse
Copyright © 2026 Seasonality.Ai. All rights reserved.