
Seasonality Outlook: 07 June 2025
Discover unique profit opportunities through seasonal patterns and events in the stock market.

Welcome to our newsletter!
Seasonality.Ai regularly provides valuable information and expertise to help you find and evaluate successful investments and trades.
The unique feature of seasonal patterns is that they signal an outlook for a probable future development.
The following charts show the seasonal patterns of various instruments. The comparison makes it possible to quickly and easily identify the strongest and weakest seasonal patterns. This data helps to assess the market situation.
In this issue, you will find relevant content to help you increase your trading success and take advantage of opportunities in the stock markets.
Seasonal Market Outlook
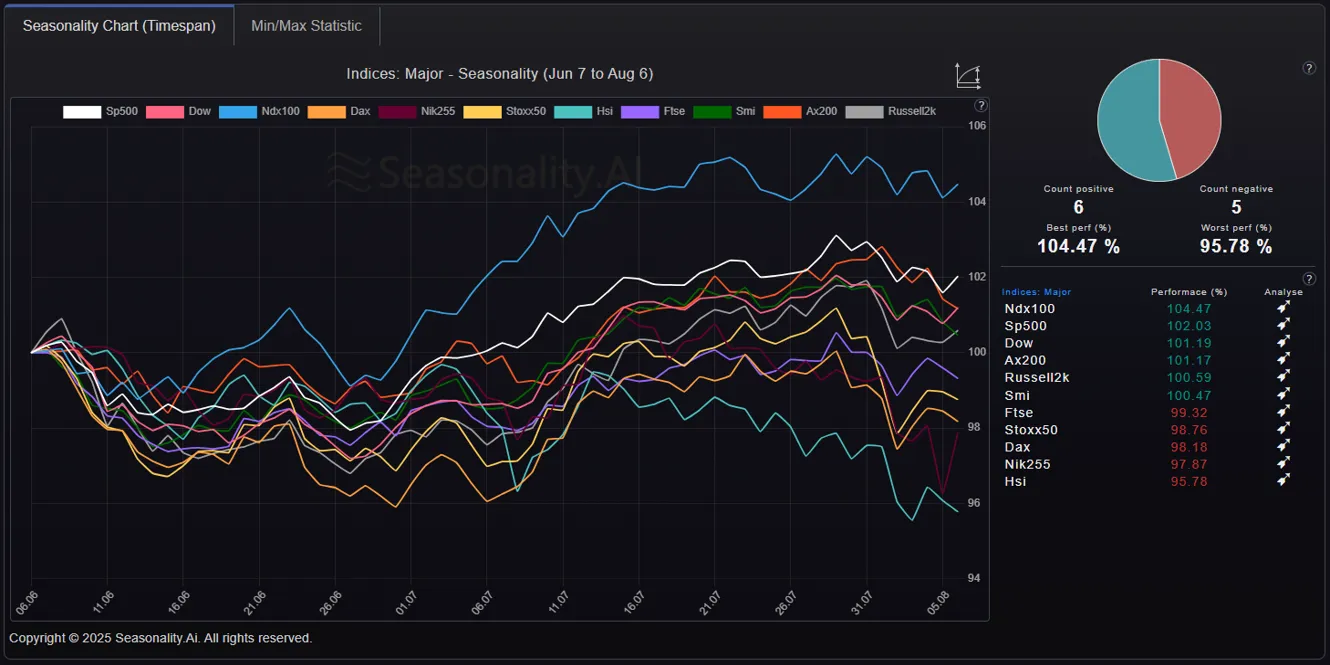
Let's start with an overview of the seasonal patterns of the major indices. The market overview shows you current seasonal trends, developments, and prospects in various asset classes.
Seasonal Patterns (Compare) Outlook: Indices
The seasonal patterns of the most important indices for the next 30 trading days are mixed with volatility.
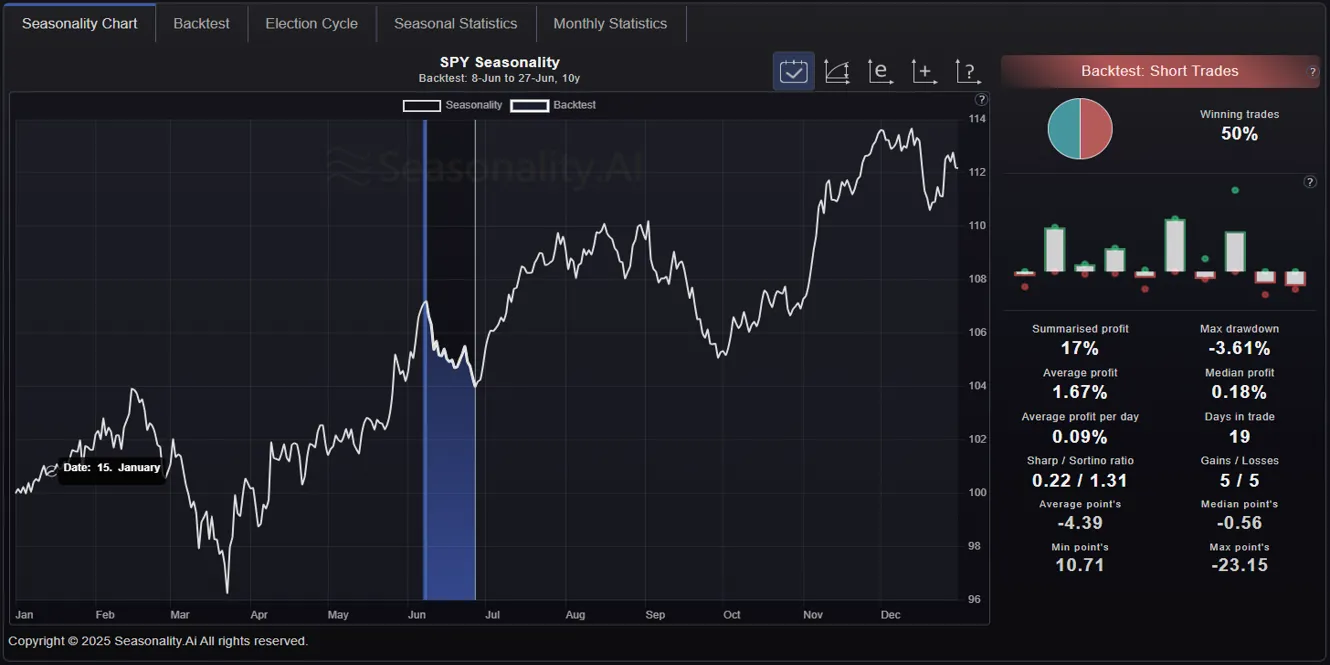
Here, you can see the seasonal pattern of the SP500 ETF for the next 30 days.
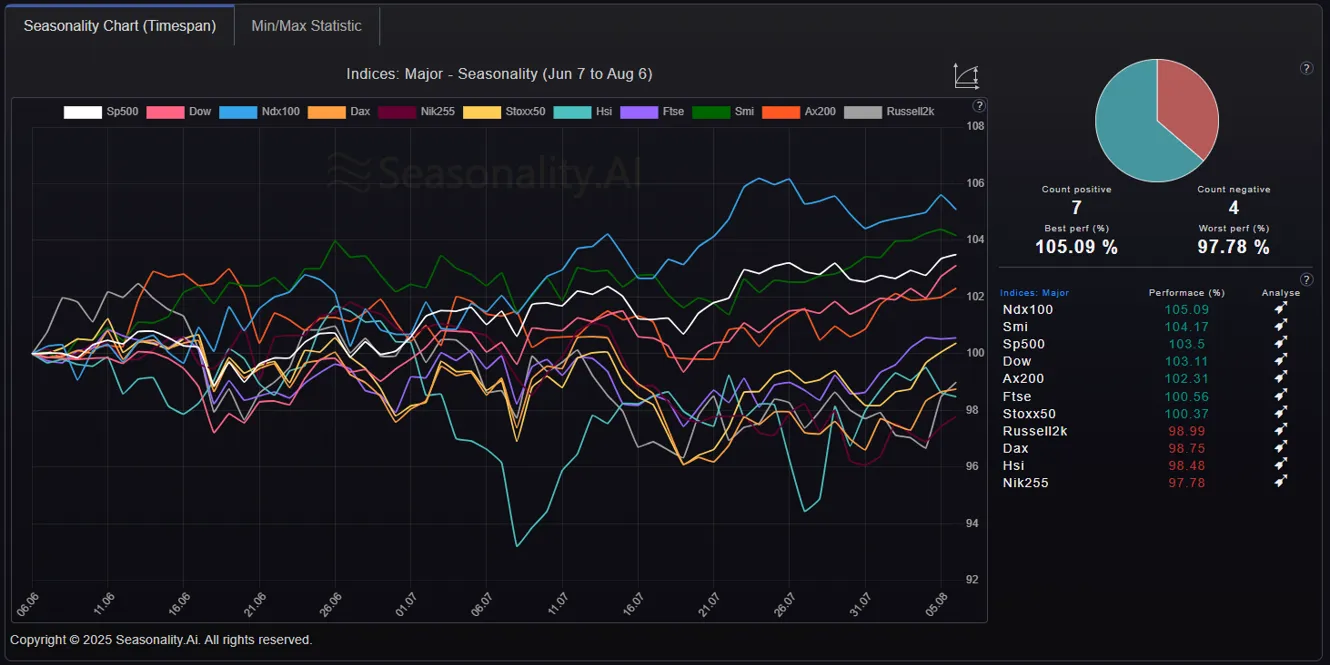
Election Seasonal Patterns (Post, Mid, Pre, Election): Indices
The seasonal patterns in the individual election years can differ significantly and, at the same time, offer good trading opportunities. The seasonal comparison chart shows the next 30 days.
You can carry out detailed election year analyses on our website with the Seasonality Analyzer with just a few clicks. The election year analysis is one of our professional clients' favorite functions.
Seasonal Intraday Patterns (Compare) Outlook: Indices
Let's take a look at the 20-day intraday seasonality of the major indices.
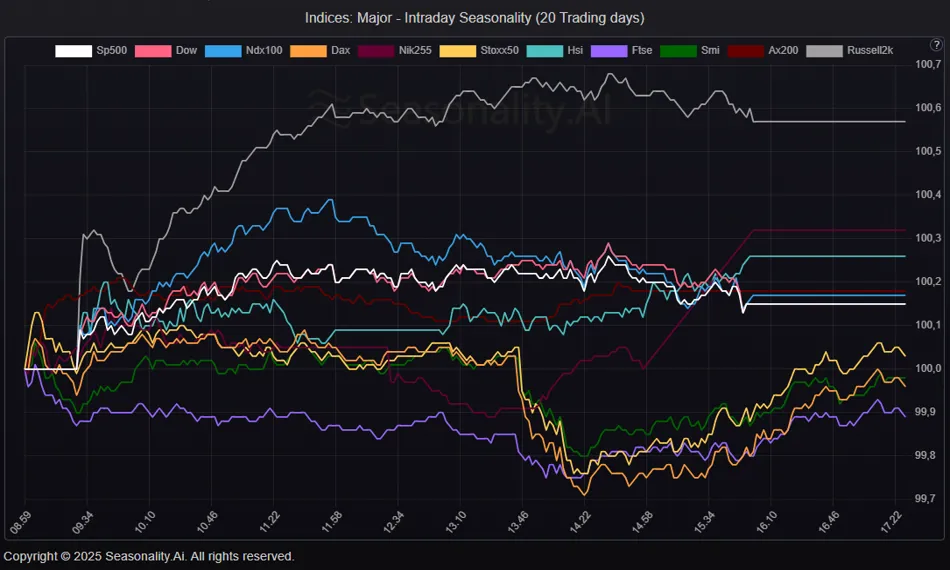
Here is the same intraday chart with the U.S. indices. 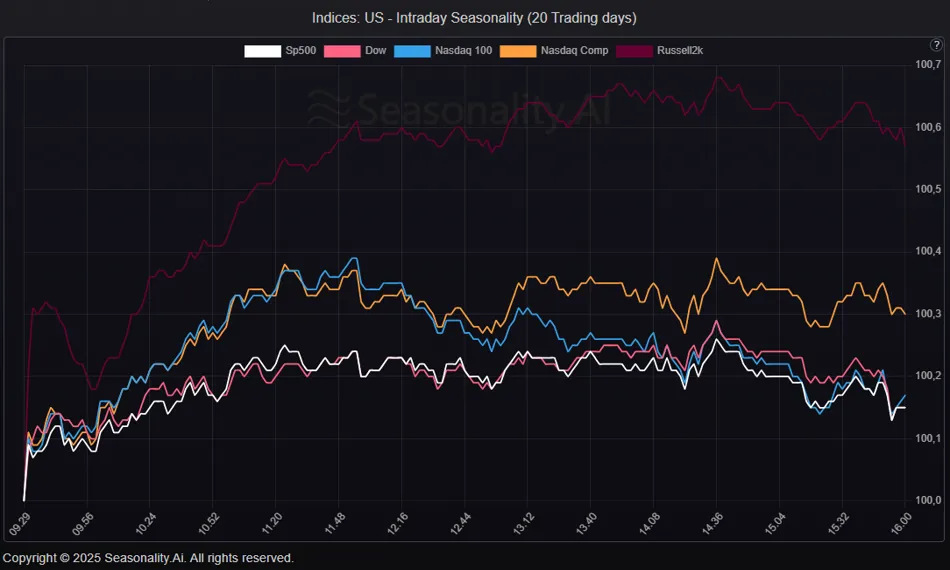
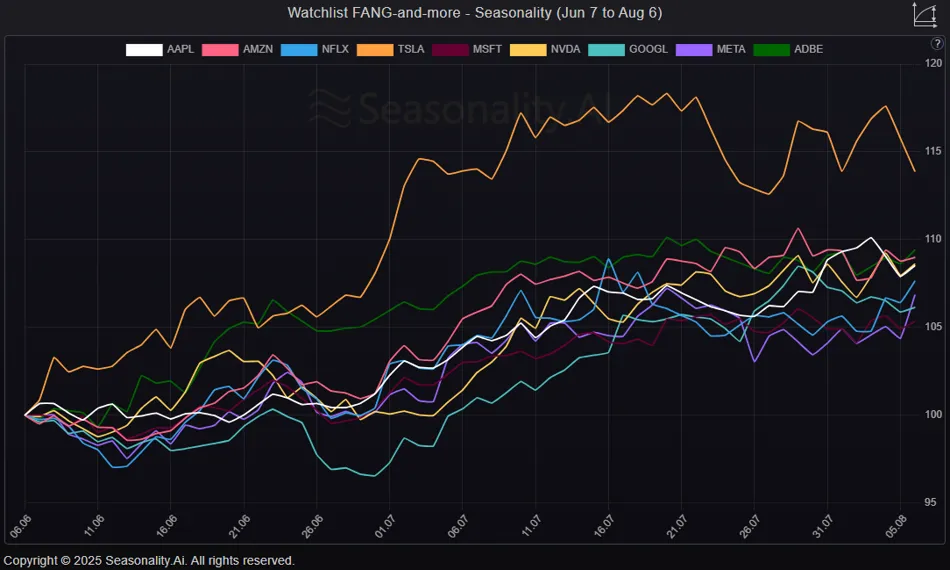
FAANNG Stocks (Seasonal patterns compare)
The following chart shows the FAANNG or MegaCap shares in a seasonal comparison chart.
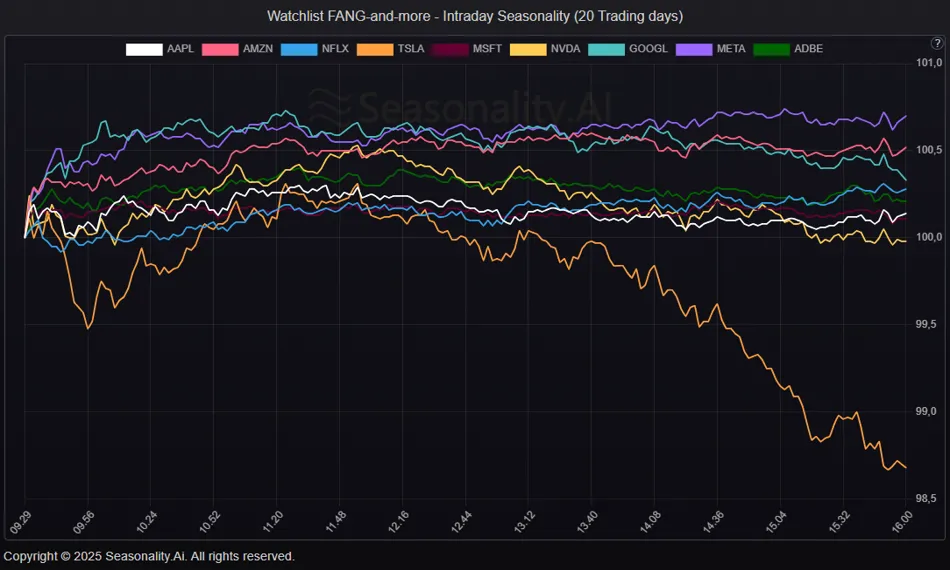
Seasonal Intraday Outlook: FAANNG and more
The seasonal 20-day patterns for the big FAANNG MarketCaps.
With our watchlist feature, you can create and analyze your own instrument lists.
U.S. Sectors
Let's take a look at the U.S. sectors.
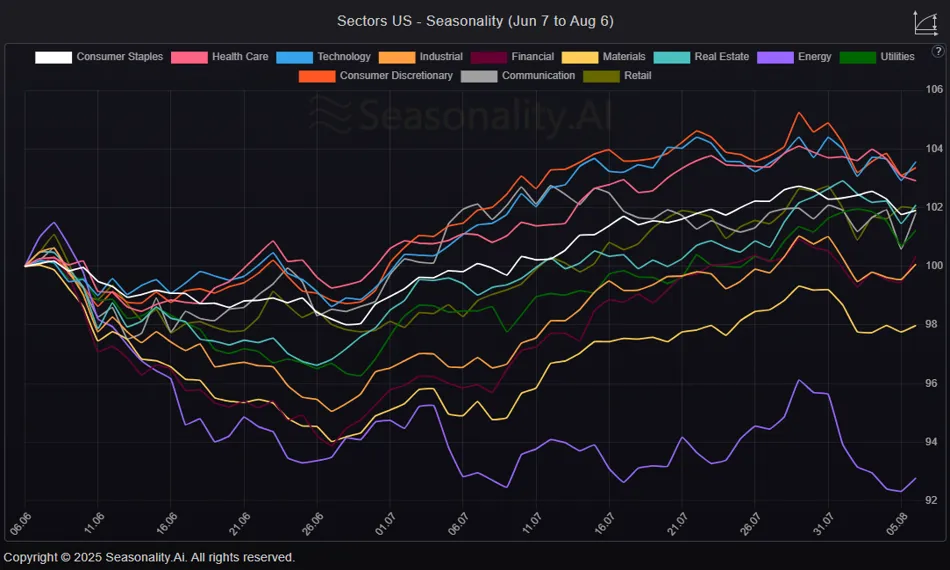
Seasonal Patterns (Compare) Outlook: U.S. Sectors
The seasonal price patterns of the sector ETFs represent the individual sectors.
ETFs: Consumer Staples (XLP), Health Care (XLV), Technology (XLK), Industrial (XLI), Financial (XLF), Materials (XLB), Real Estate (XLRE), Energy (XLE), Utilities (XLU), Consumer Discretionary (XLY), Retail (XRT), Communication Services (XLC)
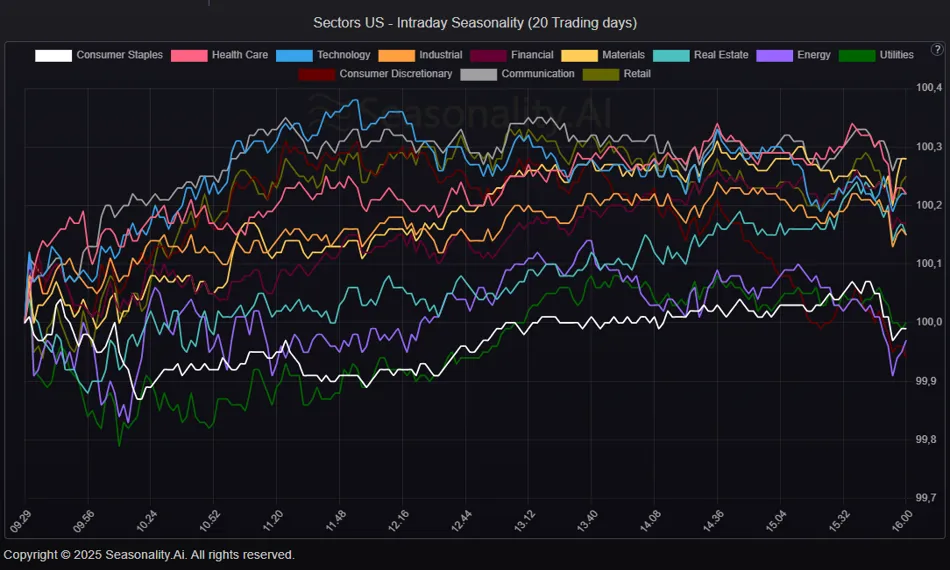
Seasonal Intraday Compare: U.S. Sectors
The seasonal 20-day patterns for the U.S. sectors.
Currencies
Let's take a look at the currencies.
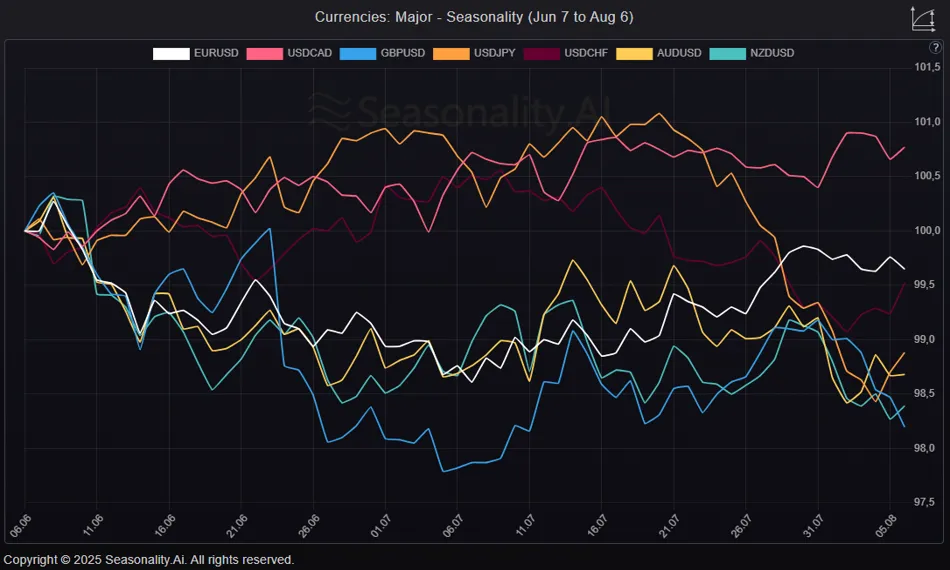
Seasonal Patterns (Compare) Outlook: Currencies
Let's take a look at the seasonal patterns for currencies over the next 30 days. Which seasonal pattern is the strongest and the weakest?
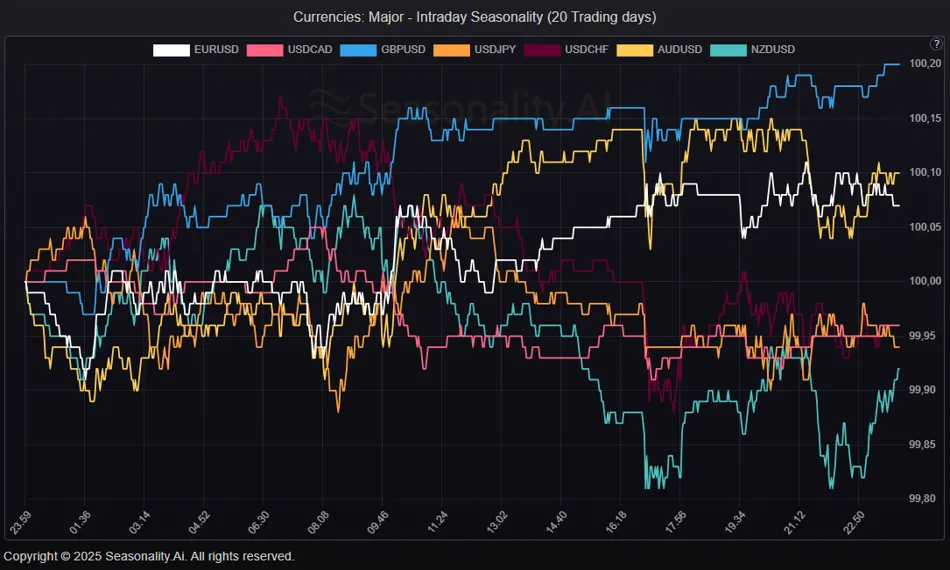
Seasonal Intraday Compare: Currencies
The seasonal intraday patterns of the last 20-day for currencies.
Crypto
Let's take a look at the crypto.
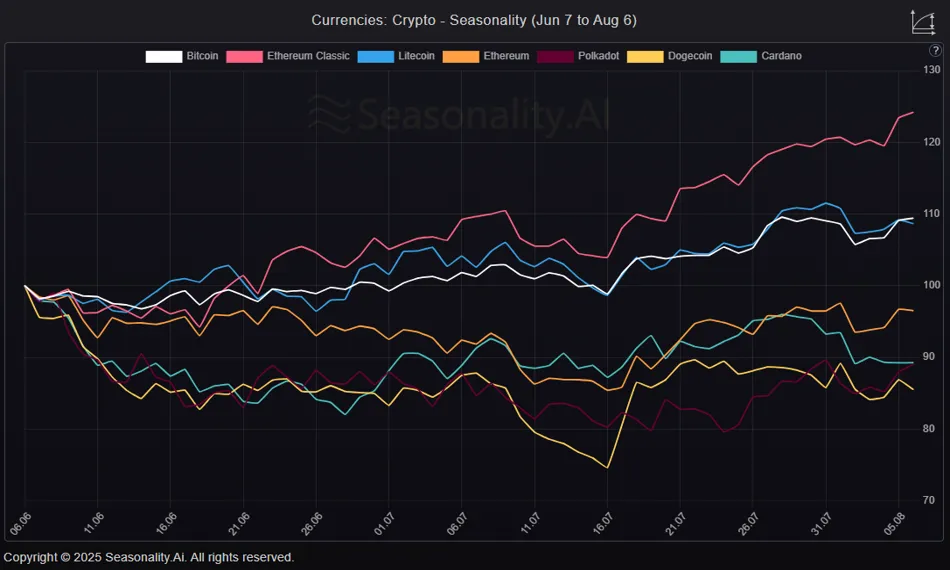
Seasonal Patterns (Compare) Outlook: Crypto
Let's take a look at the seasonal patterns for cryptos over the next 30 days. Which seasonal pattern is the strongest and the weakest?
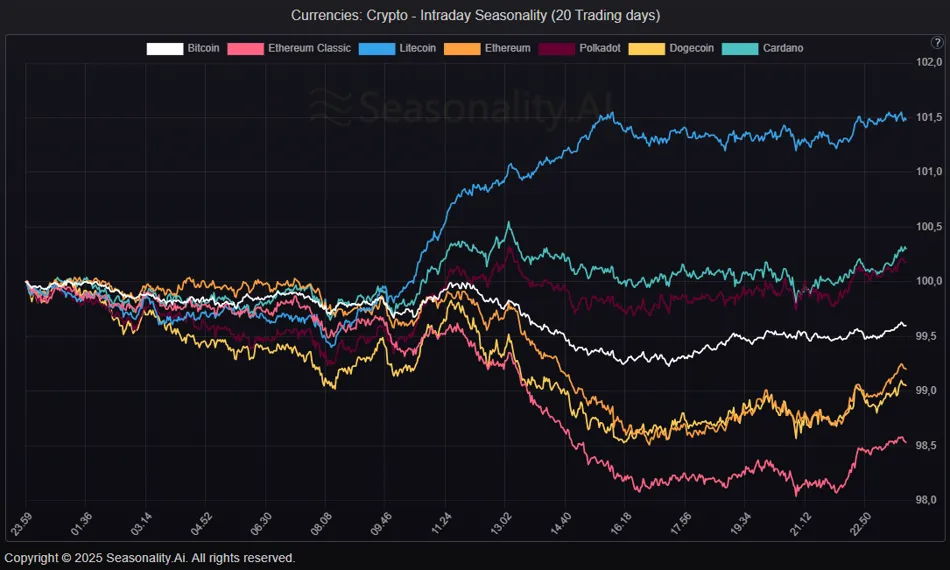
Seasonal Intraday Compare: Crypto
The seasonal intraday 20-day patterns for cryptocurrencies show a mixed picture.
Commodities
Let's take a look at the commodities.
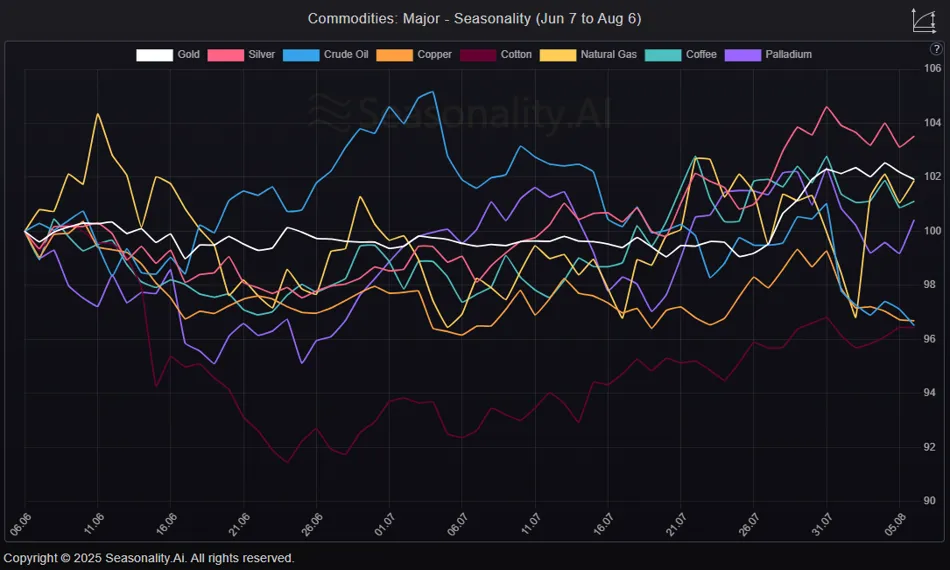
Seasonal Patterns (Compare) Outlook: Commodities
Let's take a look at the seasonal patterns for commodities over the next 30 days.
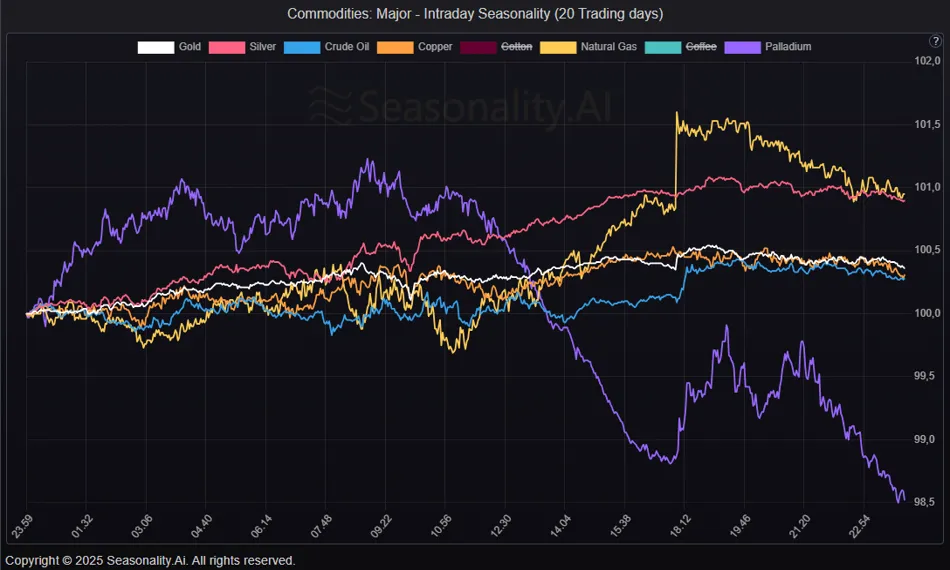
Seasonal Intraday Compare: Commodities
The seasonal intraday 20-day patterns for Commodities show a mixed picture.
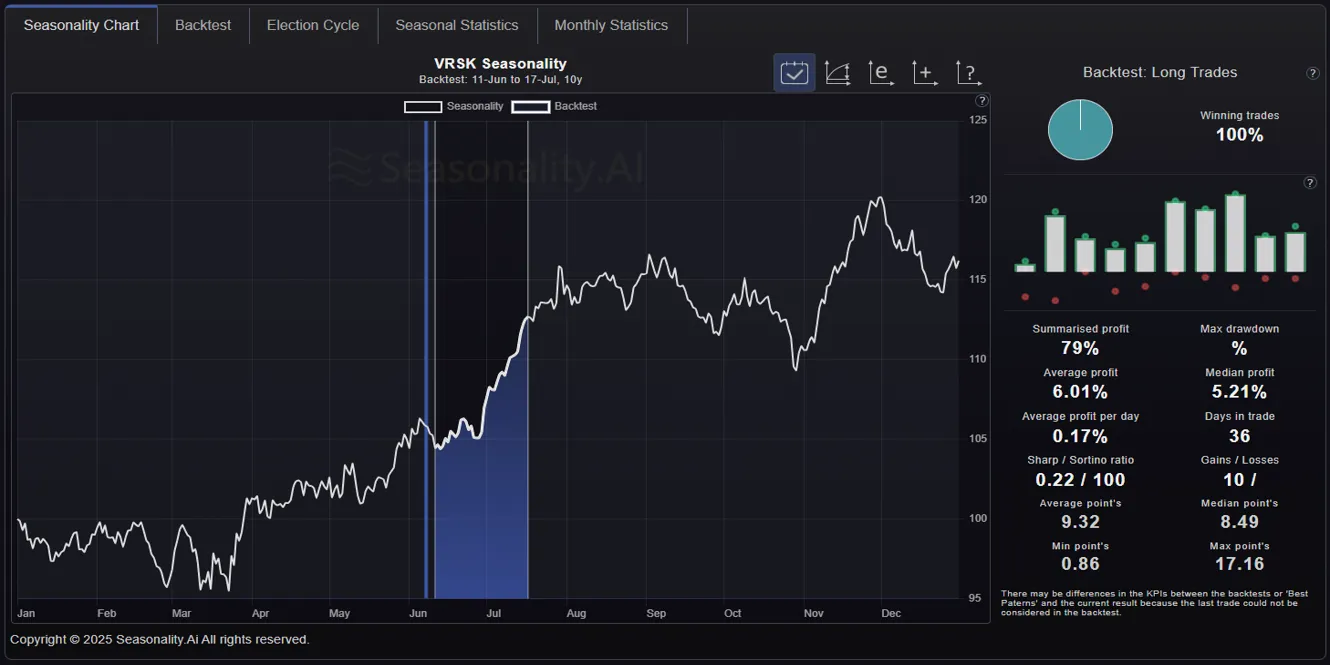
Interesting seasonal pattern
What are the opportunities based on seasonal solid patterns?
The VRSK: Verisk Analytics, Inc. Stock shows a strong historical downward movement for the next few weeks.
Profit from recurring patterns.
Take advantage of seasonal market opportunities now!
Learn more about our customized analysis tools and visit our website, seasonality.ai.
Take the chance to take your stock market success to the next level! Benefit from our analysis platform and screeners. Subscribe to our free newsletter and discover the latest strategies, tools, and tactics to help you succeed.
Our screening and analysis tools
Help you find recurring patterns with an annual accuracy rate of over 90%. The Seasonality Screener and Event Screener show you the best periodic trends for stocks, ETFs, currencies (Forex), commodities, and futures. You can find profitable times to trade and invest with just a few clicks.
Our database contains hundreds of grand entry and exit points.
The Seasonality Screener is part of our Seasonal Essentials program, which includes two other powerful tools for analyzing recurring price patterns.
For more information and analysis, visit Seasonality.Ai.
If you have any questions or suggestions, please do not hesitate to email us.