
Find the perfect timing for profitable trading with an edge – Even Intraday!
Optimize your timing with recurring price patterns and trade smarter with precise tools.
- Spot Opportunities Fast: Find the best trades in seconds.
- Ready-to-use strategies: The best patterns in one strategy.
- Optimize Profits: Perfectly timed entries and exits.
- Simple Customization: Build tailored analyses with ease.
- Comprehensive Coverage: Stocks, ETFs, Futures, Cryptos, and Intraday Data.
The Best Tools for Seasonal Trading!

Ready-To-Use Strategies
with Top Seasonal Patterns!

Unlock 3 Proven Seasonal Strategies – Completely Free! + exclusive BONUS


Join countless successful traders from over 20 countries who trust in recurring market patterns for reliable gains.

Why Seasonality?

Top-Down

Seasonality Analyser?

Intraday Seasonality?

Portfolio Strategy Builder

Seasonality Tutorial
Profits with recurring price patterns and unique approaches.
Powerfull Screeners
- Seasonality (intraday & daily) Screener
- Earnigns Screener
- Economic Event Screener
- Dividends Screener
Hundreds of Trade and Investment Opportunities are stored in our database for You.
What Our Customers Say


Effective Analysis
Recurring price patterns:
- Seasonal price patterns
- Seasonal intraday price patterns
- Portfolio Strategy Builder
- Ex-Dividend days price patterns
- Earnings release price patterns
- Economic event price patterns
Recurring Price Patterns offer Very Good Entry and Exit Points
Unlock the full potential of Recurring Price Patterns and combine our analysis software with our screeners.
Enhance Your Trading with Our Cutting-Edge Analysis Tools
Unlock the full potential of your investment strategies using our comprehensive suite of analysis tools. Explore the features and see how you can transform data into actionable insights today.
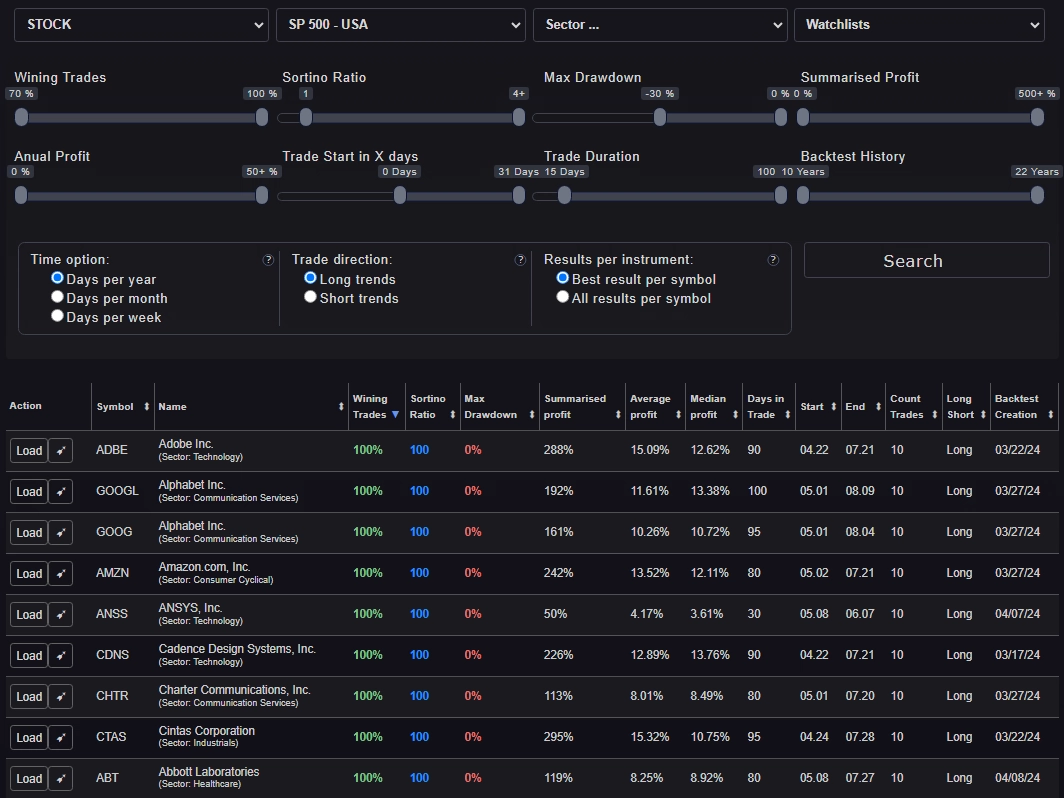
Discover Top Trading Opportunities with Our Advanced Screeners
Effortlessly pinpoint the best stocks and market trends using our powerful screener tools.
Explore now and find your next profitable trade!
Our Screeners are the most effective way to find new, highly profitable trades.
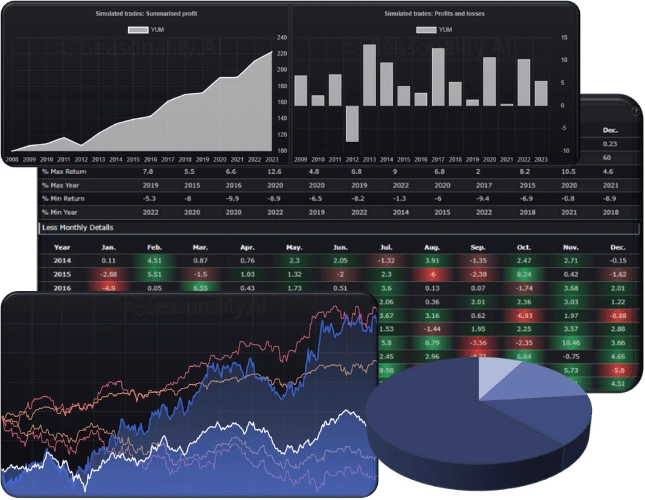
Some trade examples


Stable & profitable Trading Results
Use trades with a hit rate of more than 90%
Less drawdowns in your portfolio
Recurring Price Patterns offer Very Good Entry and Exit Points
Hundreds of Trade and Investment Opportunities are stored for You in our database
Identifying trading and investment opportunities has never been easier
Create your own in-depth analysis
Analysis Tools for Your Success
Find recurring patterns with an hit rate of over 90%
Our screener shows you the best current entry opportunities in just one click. Hundreds of trading and investment opportunities are stored in our database.
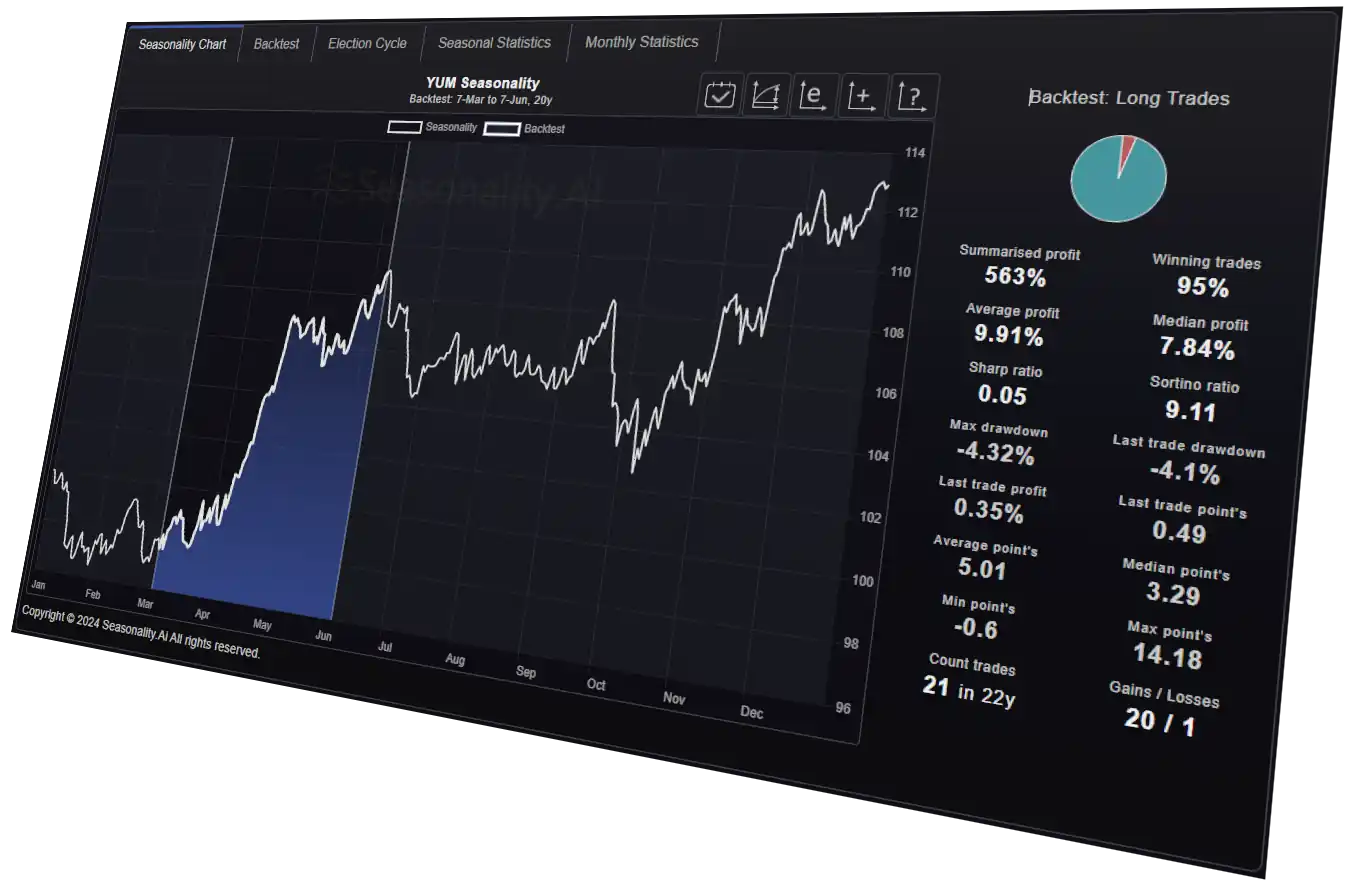
Analysis the quality of seasonality and events
Graphs, backtests and statistics show the quality of seasonal and event patterns in different time types (Annually, Monthly, Weekly and Intraday).
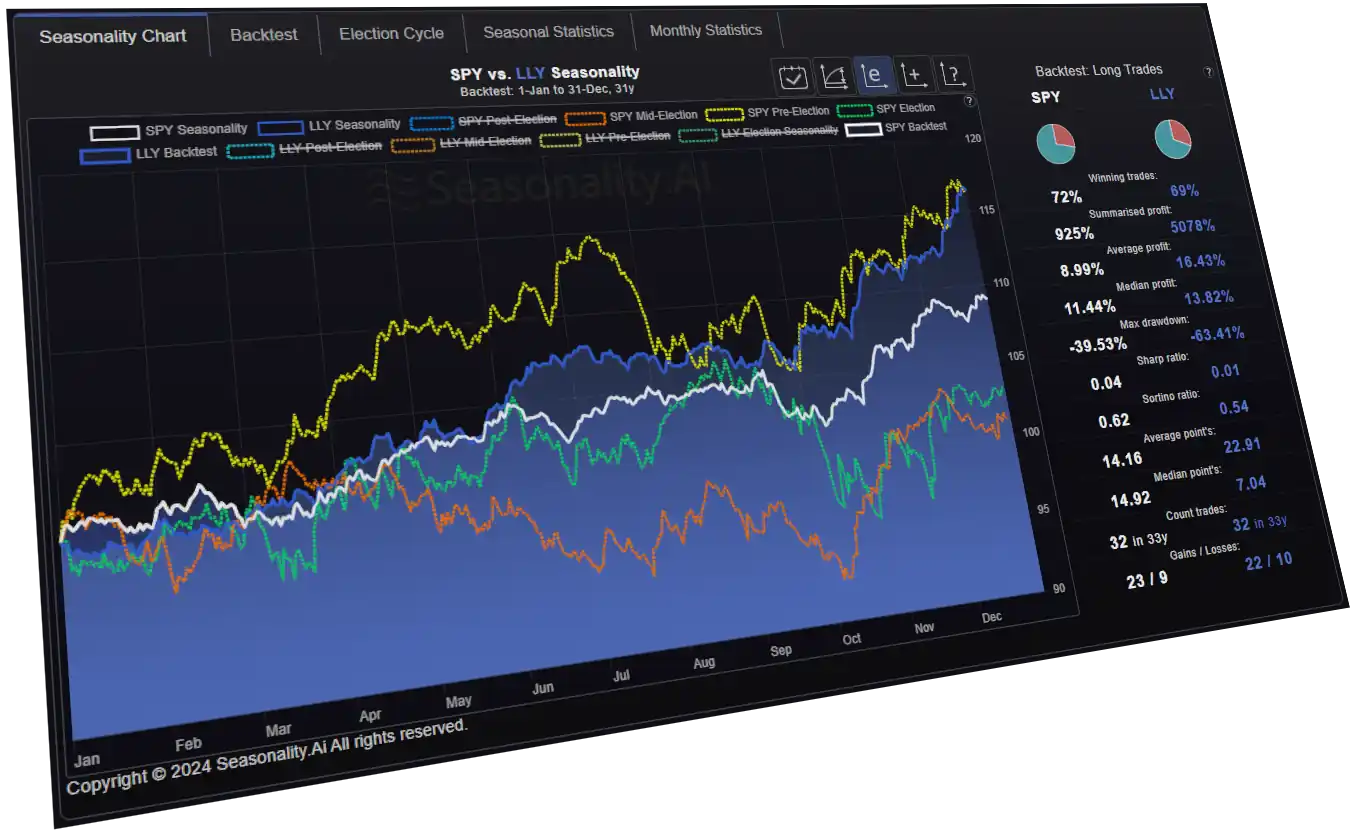
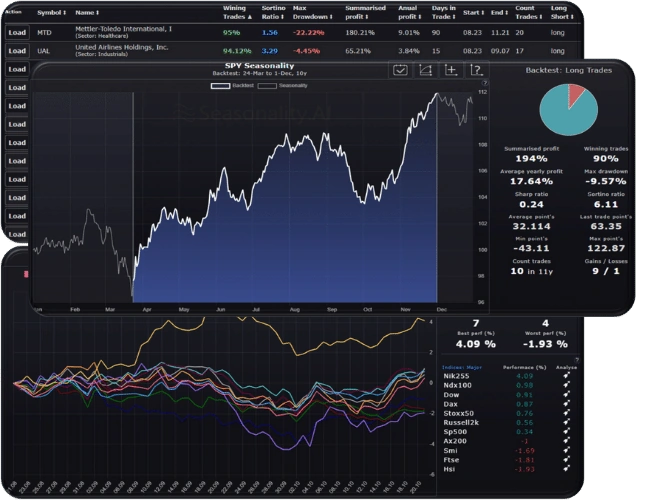
Comparative analyses
Compare the seasonal pattern of different indices, sectors, asset classes, commodities, currencies, and cryptos.
Optimize the Timing of Your Trades
Seasonal patterns show the start and end of trends with high probabilities.
Profitable time spans with an accuracy of up to 95% are not uncommon.
Take advantage of high probabilities
Profit from high win rates.
Seasonal patterns are a highly profitable trading strategy.
All markets, long or short
For stocks, ETFs, currencies (forex), commodities, bonds, and crypto, we show you the best long or short seasonal trades with the highest hit rates in all markets.
Frequently Asked Questions
How can I find profitable seasonal patterns?
Seasonality.Ai offers two ways to identify profitable seasonal patterns.
1. Seasonality Screener. The screener is a tool that identifies seasonal patterns in different markets and different time levels (Yearly, Monthly, Weekly).
2. Open the instrument of your choice and use the "Best Pattern" function. It will show you the 100 best seasonal patterns per instrument.
When do seasonal patterns work best?
There are seasonal patterns that work 100% over a more extended period. There is no guarantee that they will continue to work, but there is a high probability that they will continue to repeat.
Seasonal patterns work best when the overall trend and market sentiment match the seasonal pattern.
For example: The index should not be in a bear market for seasonal long patterns in equities. For seasonal patterns in currencies, it helps if the interest rate trend has the same direction as the seasonal pattern.
Can I analyze my portfolio?
Yes, there are various ways to analyze your equity portfolio seasonally.
1. Create a watchlist with your stocks or instruments.
You can use the watchlist in the Seasonality Screener.
The screener then searches for seasonal patterns in your portfolio.
You can also use the watchlist in the Seasonality Comparison Tool.
The comparison tool shows the seasonal patterns of all instruments in the watchlist in a chart.
2. You can save the best seasonal patterns with the favorites function.
This gives you access to the best seasonal patterns in your portfolio at any time.
Does Seasonality.Ai offer intraday analysis?
Yes, the following analysis tools analyze intraday data.
- Seasonality Analyzer - Intraday
- Seasonality Comparison - Intraday
- Event Analyzer - Intraday
Get full access as a member!
Seasonality.ai
Identifying trading & investment opportunities has never been easier.