
Seasonality Essentials Features
Seasonality improves your portfolio growth.
Over 90% Seasonal Pattern Hit Rate
Find and analyze trading decisions with high hit rates.
- Charts
- Comparisons
- Fast screening
- Backtests & statistics
Feature Highlights
Fast screening: Easily find opportunities with annual hit rates of over 90%.
Seasonal Backtests: Quality-Check of the seasonal pattern.
Detailed comparisons: Identify the best seasonal pattern with the highest potential.
Long / Short Detection & Detrending
Seasonal periods: Analyze seasonal patterns on a yearly, monthly and weekly basis.
Analysis of the US election years
Detailed Statistics: Optimize your analysis with detailed insights.
Many options and filters
If you have any suggestions for improvement or need to include functions in our tools, please feel free to send us an e-mail. We will carefully consider all requests.
Seasonality tools for professional and fast analysis


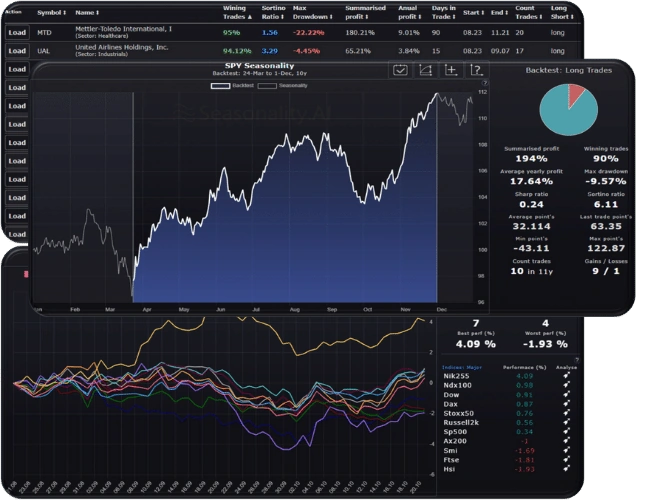
Seasonality Screener
Let our screener find the best opportunities for you!
Our screener shows seasonal patterns from various financial markets. Each entry shows the results of a backtest. The strength of the screener is that it finds trades for them with just a few clicks.
Our screener shows seasonal patterns from various financial markets. Each entry shows the results of a backtest. The strength of the screener is that it finds trades for them with just a few clicks.
Screener Highlights:
- Backtest key figures
- Timespan option for yearly, monthly and weekly patterns
- Trade direction: Long and Short
- Instrument type: Stocks, ETFs, Indices, Futures (Commodities), Currencies, Cryptos
- Various filtering options
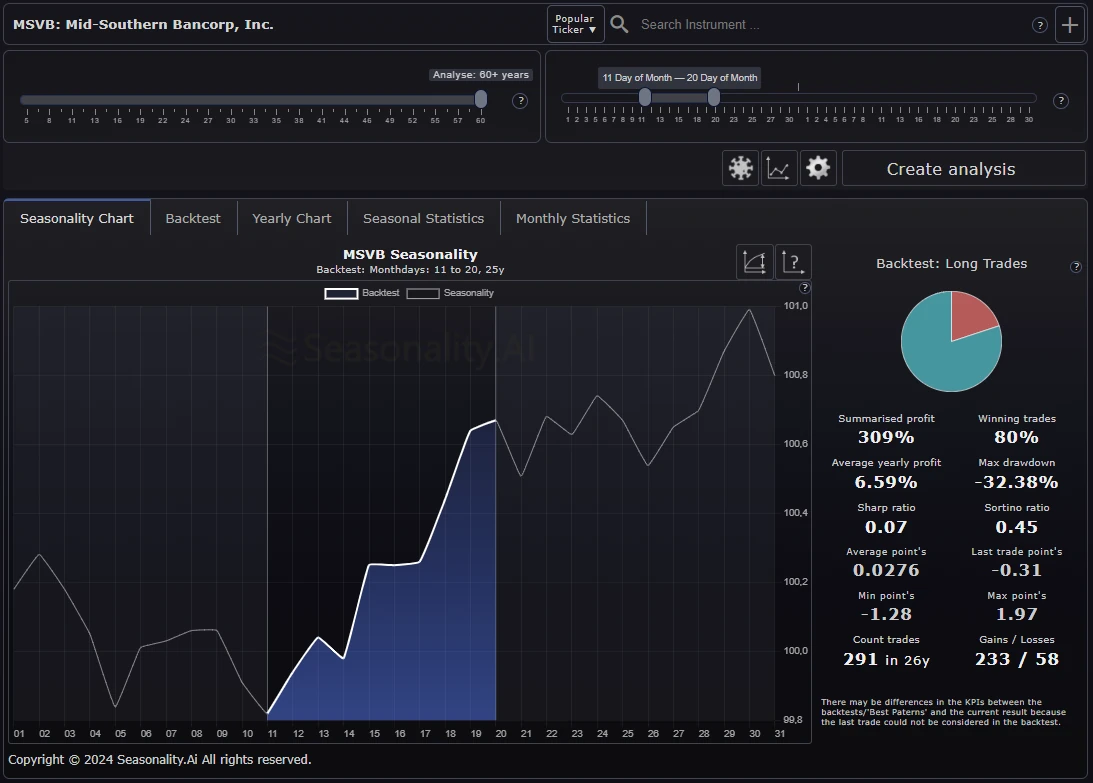
Seasonality Analyser
The Seasonality Chart Analyzer allows the analysis of recurring patterns with seasonal charts, a backtest and statistics.
The backtest shows the quality of the seasonal pattern. The statistics show optimization possibilities.
Analyser Highlights:
- Backtest key figures
- Long and Short detection
- Statistics: Year, Month, Weeks, Monthday, Weekday
- Various filtering options
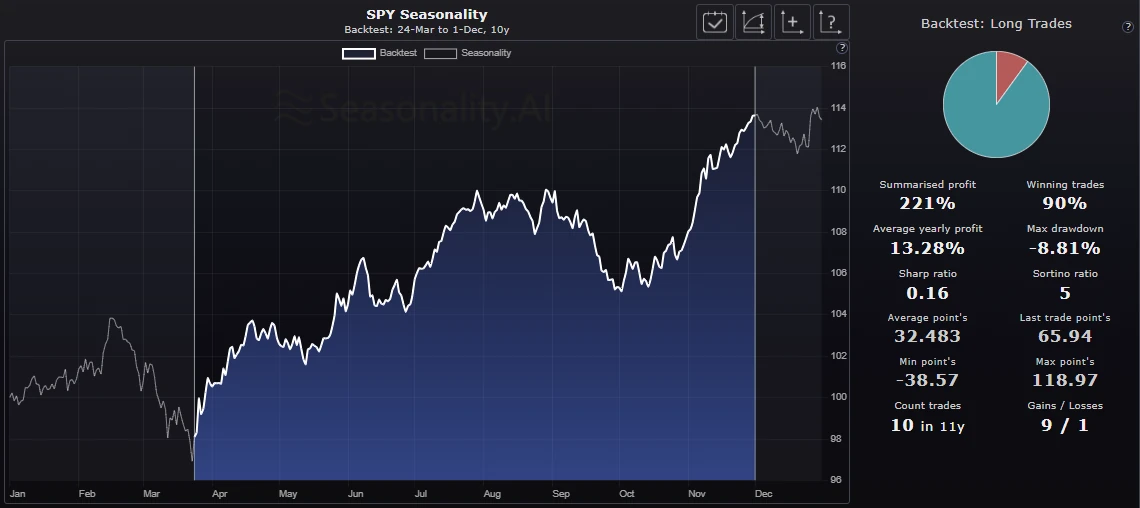
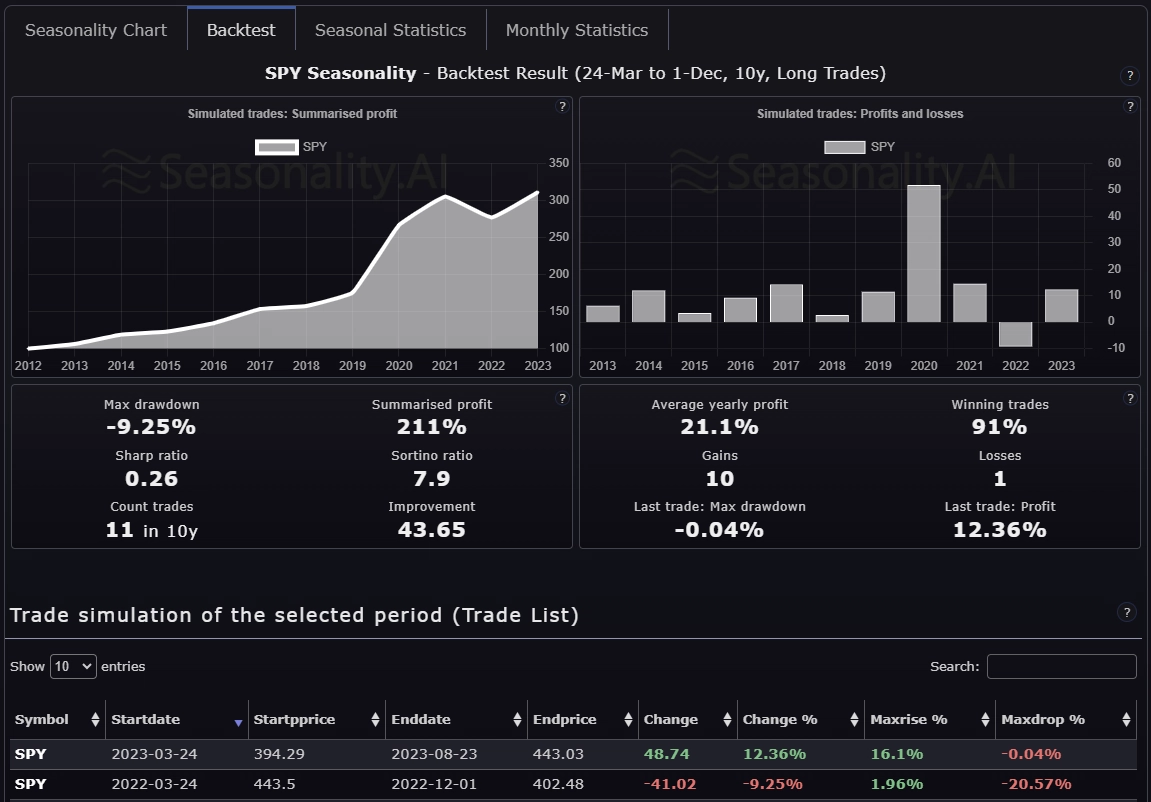
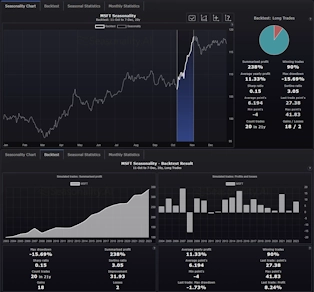
Backtest Details
The backtesting of the seasonal pattern is an essential part of the seasonal analysis and shows you two charts.
The 'Summarised Profit' chart shows the performance of the seasonal pattern that had traded.
The 'Profit and Loss' chart shows the trades per year.
The table below shows each trade in the backtest.
The 'Profit and Loss' chart shows the trades per year.
The table below shows each trade in the backtest.
Backtest:
- Summarised profit
- Profit and losses
- Trade List
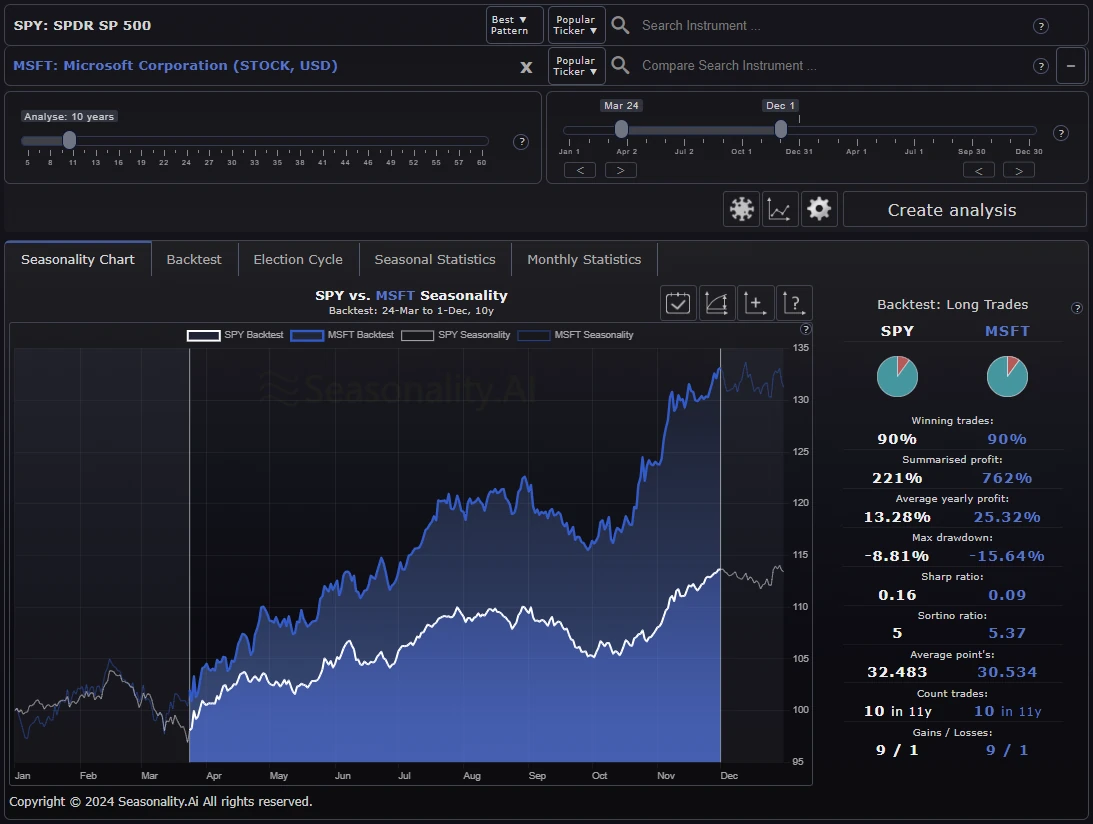
Compare two instruments
A handy and powerful feature is the ability to compare two instruments.
Two symbols are compared when you select an instrument in the 'Symbol (Compare): [+] ' field.
All graphs and data are displayed in different colors.
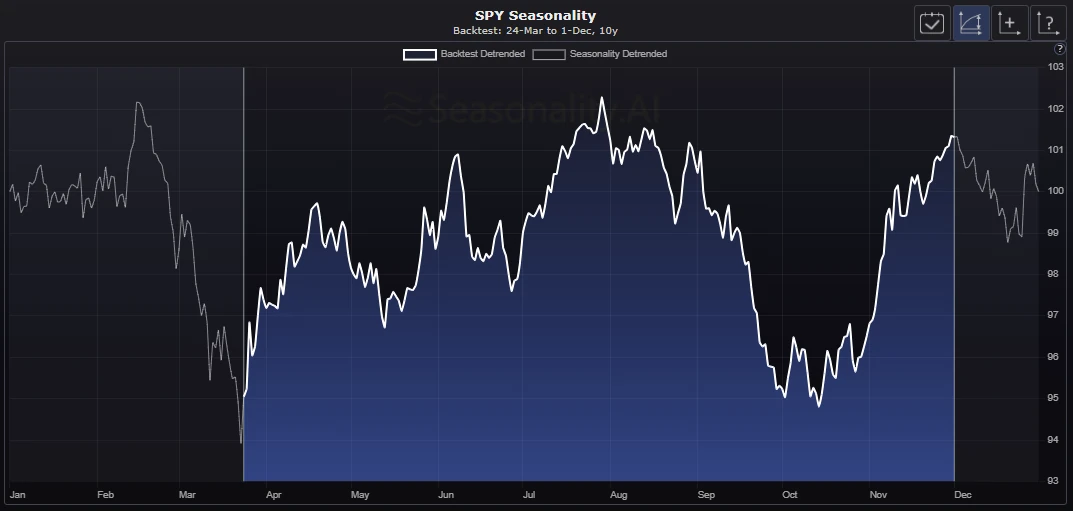
Detrending
Detrending shows seasonal patterns more clearly.
Instruments that "almost" always go up in price have seasonal patterns that are hard to see.
To identify them better, the Detrending feature is very helpful.
Detrending also supports the comparison of seasonal patterns.
- Shows seasonal patterns more clearly
- Supports the comparison of seasonal patterns
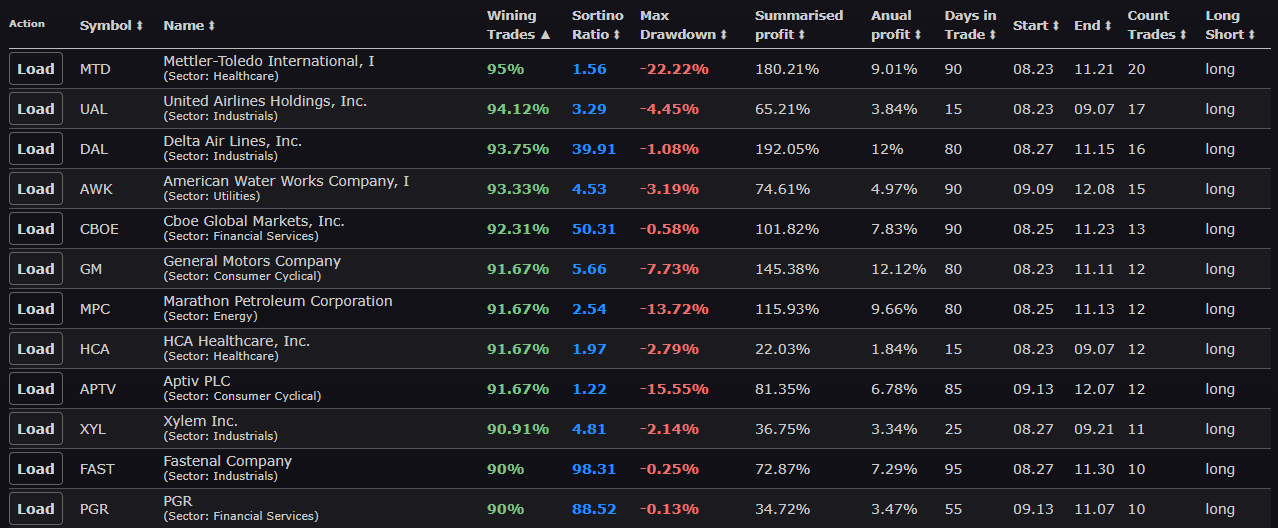
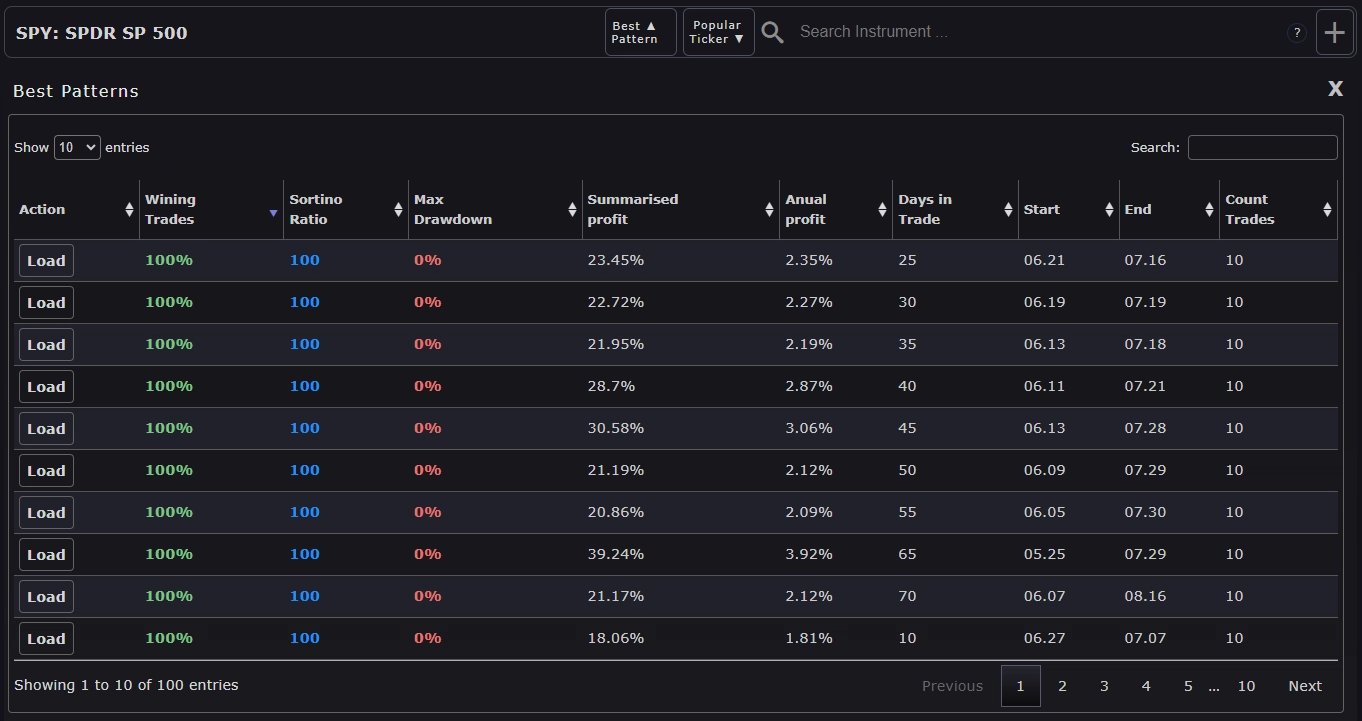
Best Pattern
You'll see up to 100 of the best seasonal patterns for each symbol.
This allows you to access the best seasonal patterns of a symbol quickly.
We show all the essential key figures in the overview for each seasonal pattern.
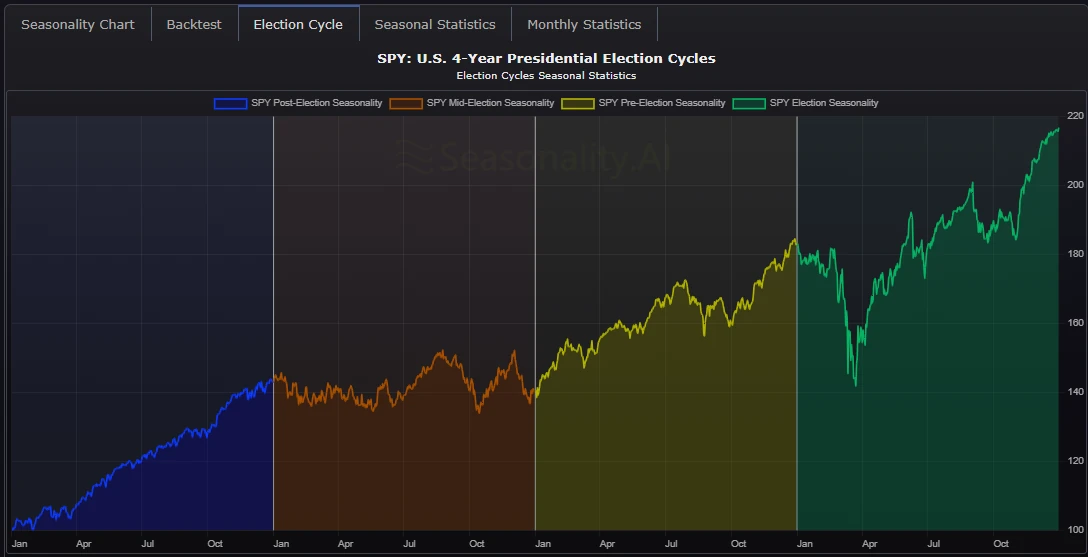
U.S. Election Cycle analysis
Analyze how the price has developed in the election years.
With the filter options, you can exclude election years (Mid, Pre, Election, Post) from the analysis to get detailed information on how the price has behaved in the different election years.
With the filter options, you can exclude election years (Mid, Pre, Election, Post) from the analysis to get detailed information on how the price has behaved in the different election years.
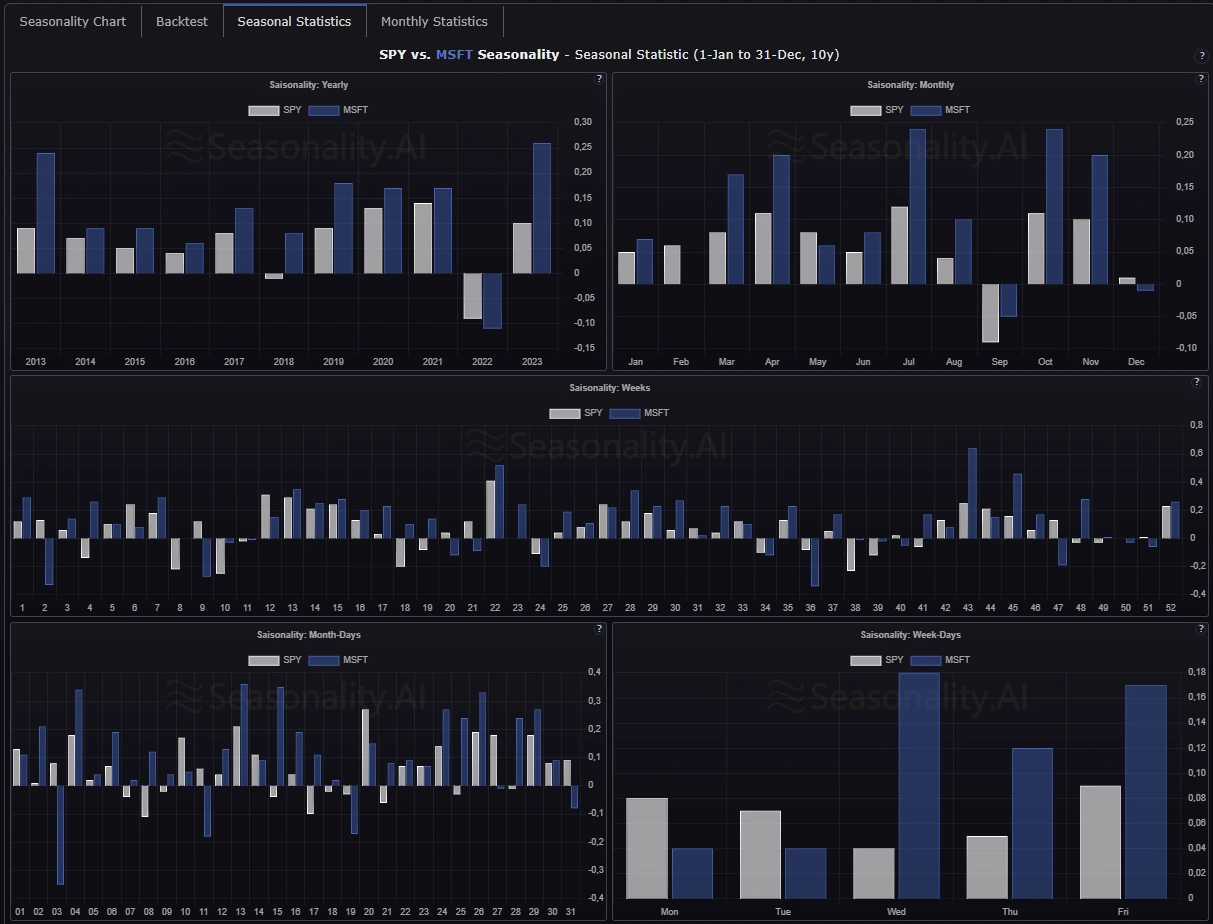
Statistics
The statistical chart shows you the average development of the different periods.
Evaluations help you to optimize the analysis period and improve the quality of the analysis.
With this information, you can see more details and, if necessary, apply filters (exclude years, months, or weeks) to get better results and implement a better strategy or trade.
With this information, you can see more details and, if necessary, apply filters (exclude years, months, or weeks) to get better results and implement a better strategy or trade.
The following diagrams are available:
- Annual pattern
- Monthly pattern
- Weekly pattern
- Days per month
- Days per week
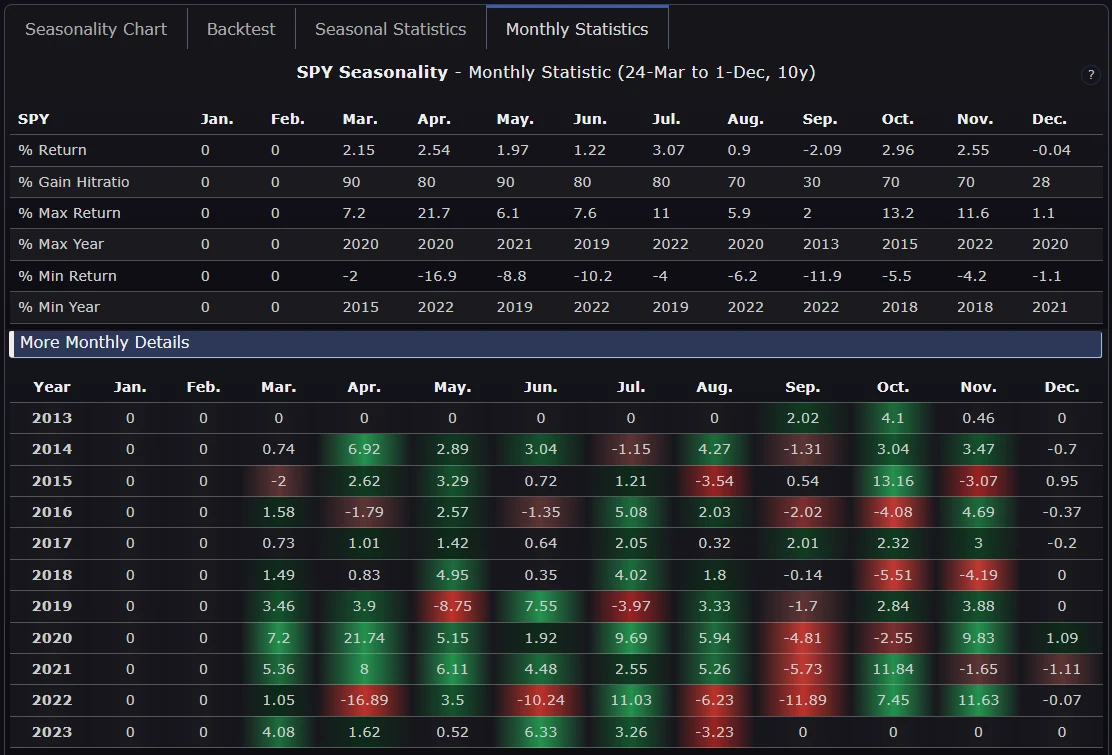
Monthly Statistic
The monthly statistics show you further key figures that give you a deeper insight into the ongoing price development.
With this information, you can see more details and if necessary, apply filters (exclude months) to get better results and implement a better strategy or trade.
With this information, you can see more details and if necessary, apply filters (exclude months) to get better results and implement a better strategy or trade.
Seasonal time periods
Seasonal patterns come in different time spans.
Seasonal patterns exist in different periods. The best known are time intervals within 365 days. Our Seasonality Analyzer can also create analyses within 30 days (monthly basis) and 7 days (weekly basis).
Seasonal patterns exist in different periods. The best known are time intervals within 365 days. Our Seasonality Analyzer can also create analyses within 30 days (monthly basis) and 7 days (weekly basis).
With the analysis every month, you can analyze seasonal monthly effects. The same applies to the study every week.
Available seasonal time periods:
- Days within years
- Days within months
- Days within weeks
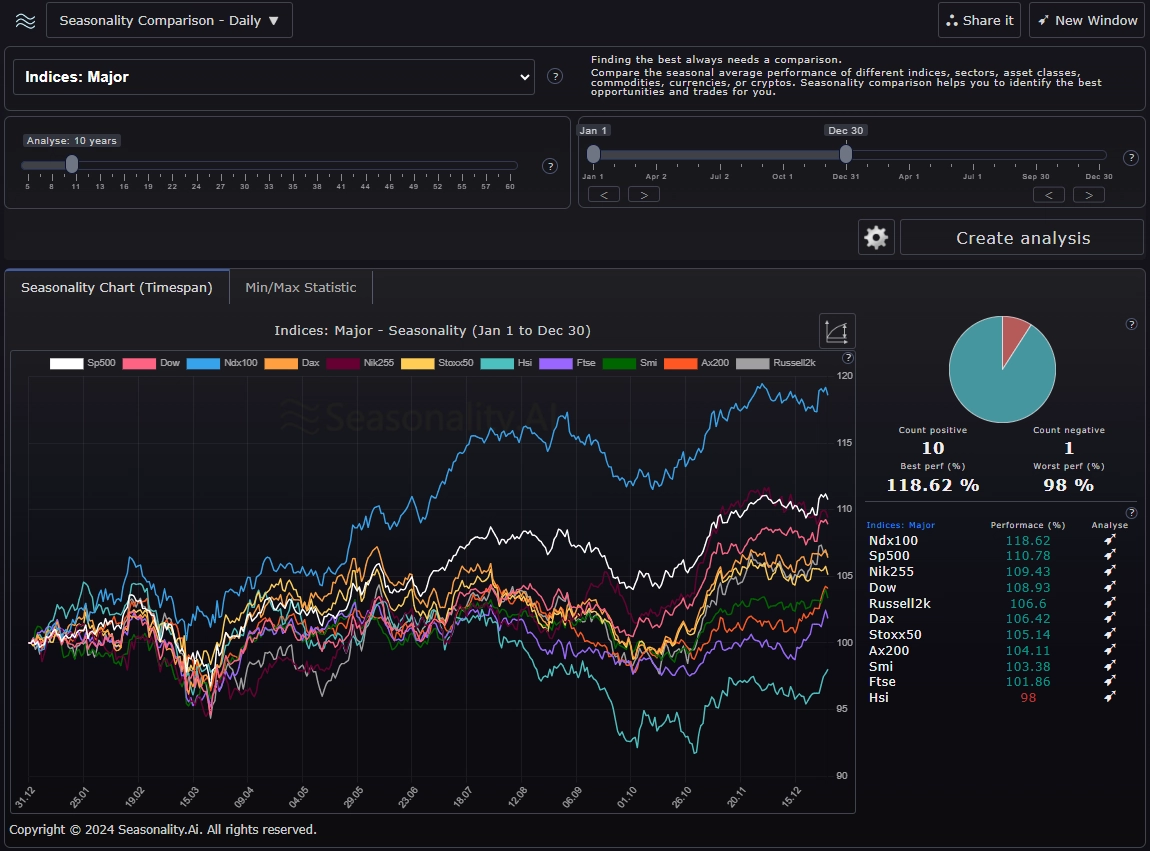
Instrument Bundle Comparison
Compare the seasonal average performance of different indices, sectors, asset classes, commodities, currencies, and cryptos.
Seasonality comparison helps you compare different markets. This allows you to identify the best trades for you.
There are currently over 25 different instrument bundle available.
What should a practical analysis tool look like?
Relevant & insightful data
Many free analyses display 1-2 data series in a chart. This is usually helpful for a rough assessment of situations. But to make sustainable and profitable trading decisions, more insight is needed.
Content-rich data:
- Backtests show the "What would have been the profit if I had implemented the same action in the past?" scenario very well.
- Metrics quickly show the quality of the analysis's result.
- Data filter options allow you to recreate historical situations.
Speed & functionality
Time is a limiting factor for many private market participants. Most private individuals have a job, family, and hobbies. There is little time for extensive research and analysis.
Good analysis tools:
- Show relevant data quickly and clearly.
- Offer useful filters and configuration options.
- Offer powerful screeners.
- Offer comparative analysis of multiple instruments.
Quality is more important than quantity in a world with much data.
Get full access as a member!
Seasonality.ai
Identifying trading & investment opportunities has never been easier.