
Stocks to Buy Now in 2023
Our screener shows you the current best entry opportunities.
There are many reasons for the price of a share to rise.
What is much more interesting is whether the price rises every time.
The Basic Idea
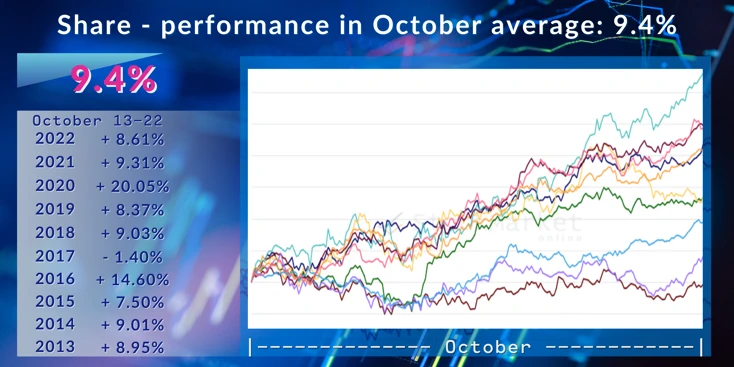
Recurring price patterns are a very good timing tool. With this method you can see which stocks you should buy now.
For example, if a stock always rises by an average of 8% every October, there is a very high probability that it will also rise by 8% the next October.
Recurring Patterns is one of the Most Underestimated Analysis Methods among Private Investors.

Buy or Sell in Practice
You need special software to determine the optimal entry and exit times. On our platform you will find detailed analyses for the best entry and exit times.
You can take full advantage of these benefits with our platform.
Higher Profits in Less Time
Investing only in the strongest times increases your chances of success.

A Small Example from the Field

Professional analysis tools for your success
All three Seasonality tools are part of the Seasonality Essential subscriber offer.
All subscriptions start with a free seven-day trial.
Annual payments receive an additional 10% discount.
Essentials
• Seasonality Screener
• Seasonality Comparison
Essentials
• Intraday Seasonality Screener
• Intraday Seasonality Comparison
Essentials
It only makes sense in combination with Seasonality Essentials.
Seasonality Essentials |
Intraday Seasonality Essentials |
Portfolio Essentials |
Earnings Essentials |
Dividends Essentials |
|
|---|---|---|---|---|---|
|
Seasonality Analyser
• Access to all instruments
• Over 20000 symbols • ETFs, futures, currencies, crypto and stocks from over 30 major indices • Detailed analysis without restrictions on instruments or functionality • Analysis periods: Anual, Monthly, Weekly |
✓ | ✖ | ✖ | ✖ | ✖ |
|
Seasonality Screener
• Find the best seasonal trends with few clicks.
• Screening over 20000 instruments • ETFs, futures, currencies, crypto and stocks from over 30 major indices • Many seasonal patterns with over 90% hit rate • Search for seasonal patterns in Personalized Watchlists • Screening periods: Anual, Monthly, Weekly |
✓ | ✖ | ✖ | ✖ | ✖ |
|
Seasonality Comparison
• Access to all predefined intrument lists
• Compare your personalized watchlists • Analysis periods: Anual |
✓ | ✖ | ✖ | ✖ | ✖ |
|
Intraday Seasonality Analyser
• Access to all instruments with Intraday data
• Over 900 symbols • Stocks, ETFs, futures, currencies and cryptos • Detailed analysis without restrictions on instruments or functionality • Analysis periods: Intraday |
✖ | ✓ | ✖ | ✖ | ✖ |
|
Intraday Seasonality Screener
• Find the best seasonal trends with few clicks.
• Screening over 1000 instruments • ETFs, futures, currencies, crypto and stocks from over 30 major indices • Many seasonal patterns with over 90% hit rate • Search for seasonal patterns in Personalized Watchlists • Screening periods: Intraday |
✖ | ✓ | ✖ | ✖ | ✖ |
|
Intraday Seasonality Comparison
• Access to all predefined intrument lists
• Compare your personalized watchlists • Analysis periods: Intraday |
✖ | ✓ | ✖ | ✖ | ✖ |
|
Portfolio Strategy Builder
• Analyse different seasonal samples in a portfolio.
• Unlimited portfolios. • Portfolio Strategy items: Anual Seasonality patterns • Portfolios Strategies: Max 50 items. • Over 20000 symbols • Stocks, ETFs, futures, currencies and cryptos • Detailed portfolio analysis without restrictions on instruments or functionality |
✖ | ✖ | ✓ | ✖ | ✖ |
|
Earnings Analyser
• Access to all stocks
• Over 5000 symbols • Stocks from over 30 major indices • Detailed analysis without restrictions on instruments or functionality • Analysis periods: Anual (Day by Day) |
✖ | ✖ | ✖ | ✓ | ✖ |
|
Earnings Screener
• Find the best earnings pattern with few clicks.
• Screening over 5000 instruments • Stocks from over 30 major indices • Many seasonal patterns with over 90% hit rate • Search for seasonal patterns in Personalized Watchlists • Analysis periods: Anual (Day by Day) |
✖ | ✖ | ✖ | ✓ | ✖ |
|
Dividends Analyser
• Access to all stocks
• Over 5000 symbols • Stocks from over 30 major indices • Detailed analysis without restrictions on instruments or functionality • Analysis periods: Anual (Day by Day) |
✖ | ✖ | ✖ | ✖ | ✓ |
|
Dividends Screener
• Find the best earnings pattern with few clicks.
• Screening over 5000 instruments • Stocks from over 30 major indices • Many seasonal patterns with over 90% hit rate • Search for seasonal patterns in Personalized Watchlists • Analysis periods: Anual (Day by Day) |
✖ | ✖ | ✖ | ✖ | ✓ |
What Our Customers Say


Take advantage of our risk-free trial.