
Trade all year round with the most reliable seasonal patterns.
Seasonality improves your portfolio growth.
Over 90% Seasonal Pattern Hit Rate
Reduce uncertainty and maximize profits with Seasonality.
- Find high hit rates
- Optimize your timing
- Use backtest and statistics
- Use our seasonality screener
Seasonality and Recurring Patterns
Seasonality arises from fundamental, repetitive developments.
Seasonal patterns in the stock market result from recurring economic cycles and corporate developments. There are also excellent seasonal patterns in currencies, commodities, and the crypto universe.
Seasonal patterns in the stock market result from recurring economic cycles and corporate developments. There are also excellent seasonal patterns in currencies, commodities, and the crypto universe.
Seasonality is a powerful indicator with high hit rates.
What is a seasonal chart?
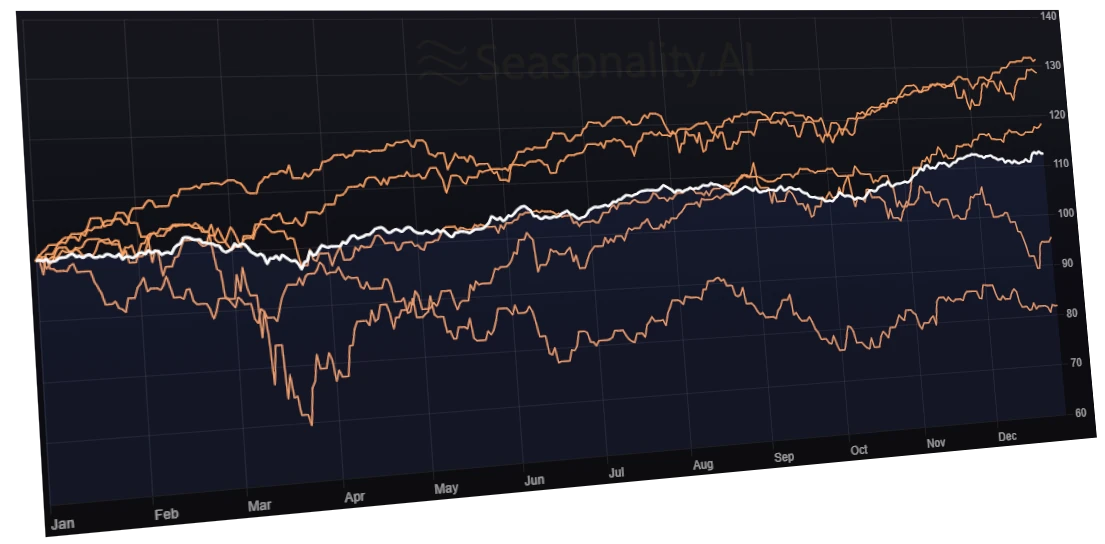
A seasonal chart combines the trend of past years into one year. A seasonality chart is a graphical representation of the patterns and trends in data that repeat over time.
A seasonal chart combined with a backtest and other statistics shows the quality, reliability, and trend of the natural development behind the seasonal pattern.
You can use seasonal analysis to your advantage when trading in the financial market.
What is a seasonal analysis?
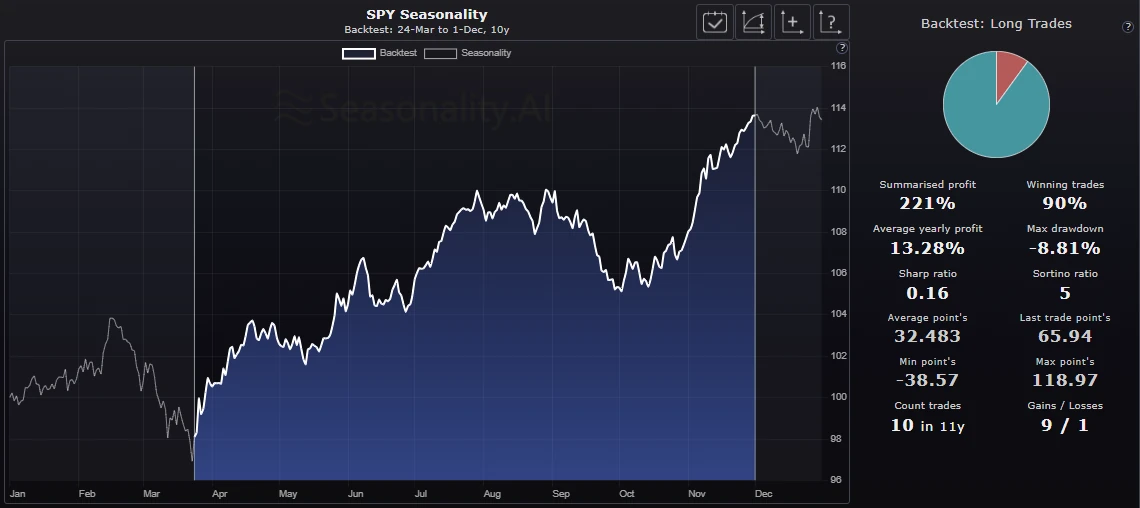
A seasonal analysis shows the probability of the occurrence of a recurring pattern.
Seasonal analysis is more than a simple seasonal chart. High-quality research includes detailed backtesting and other statistics and filtering options.
In practice, the presentation of relevant and meaningful data is crucial.
In practice, the presentation of relevant and meaningful data is crucial.
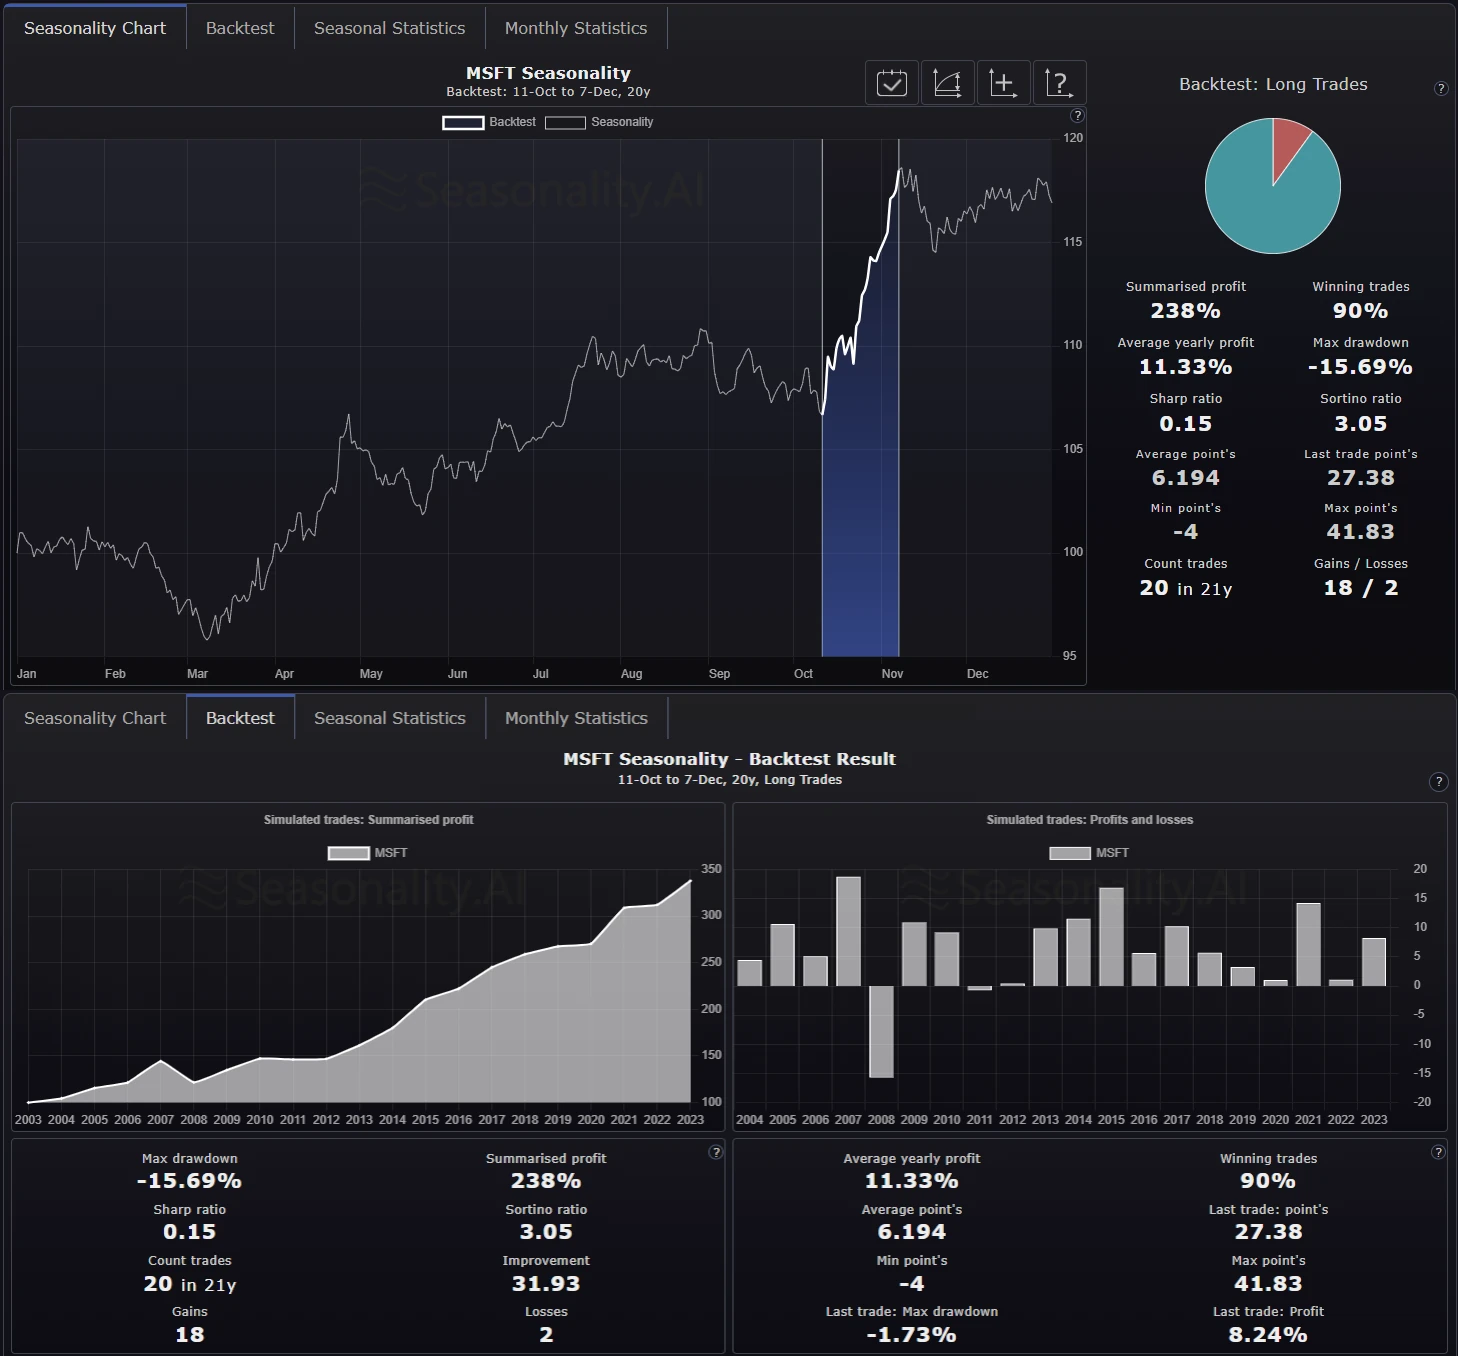
Seasonality in Stocks: Microsoft
Here is an example of a seasonal pattern in the stock of Microsoft. In October, the stock has risen an average of 11.90% over the last ten years.
Earnings are the most common reason for seasonal patterns, especially in equities.
Microsoft is just one example of many possibilities. Our database contains hundreds of grand seasonal entry and exit points.
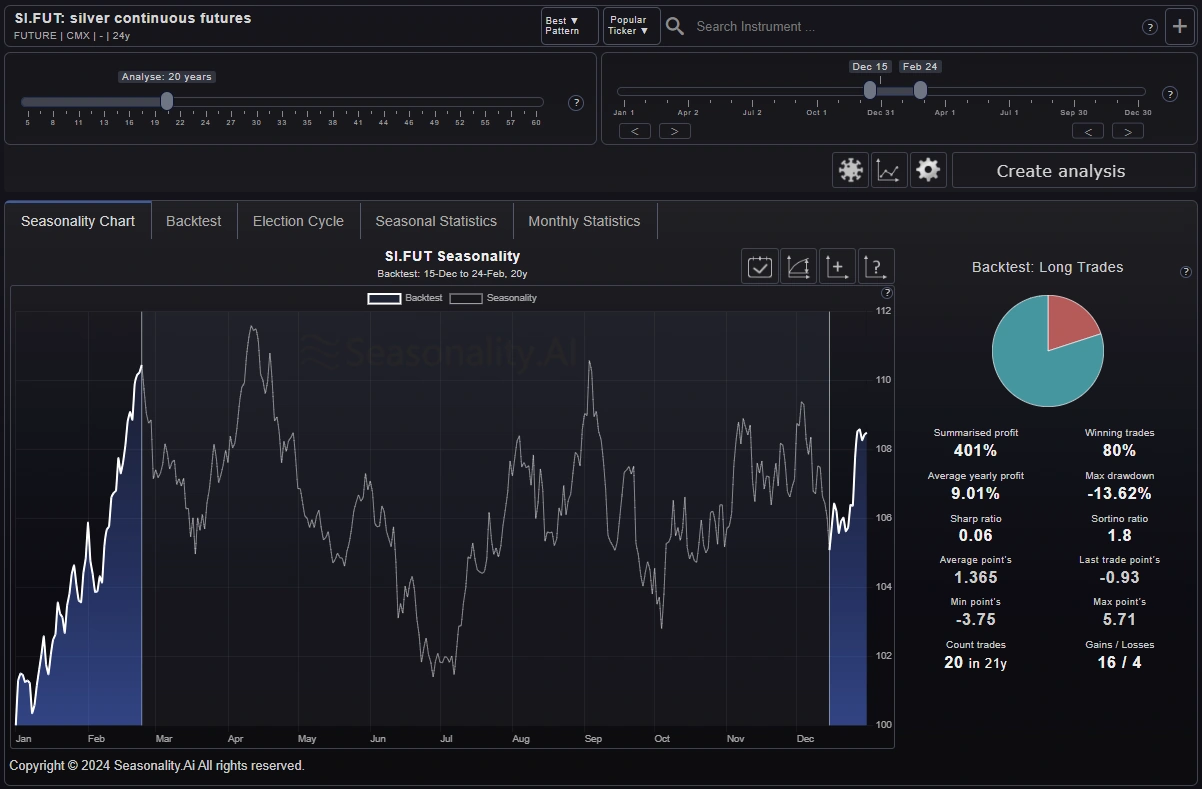
Seasonality in metal: Silver
Silver has a seasonally strong pattern at the end of the year (just like gold). The precious metal rises an average of 25% during this period.
The other precious metals also show strong seasonal patterns.
With our Seasonality Comparison Tool you can display the seasonal patterns of the various metals in a chart.
With our Seasonality Comparison Tool you can display the seasonal patterns of the various metals in a chart.
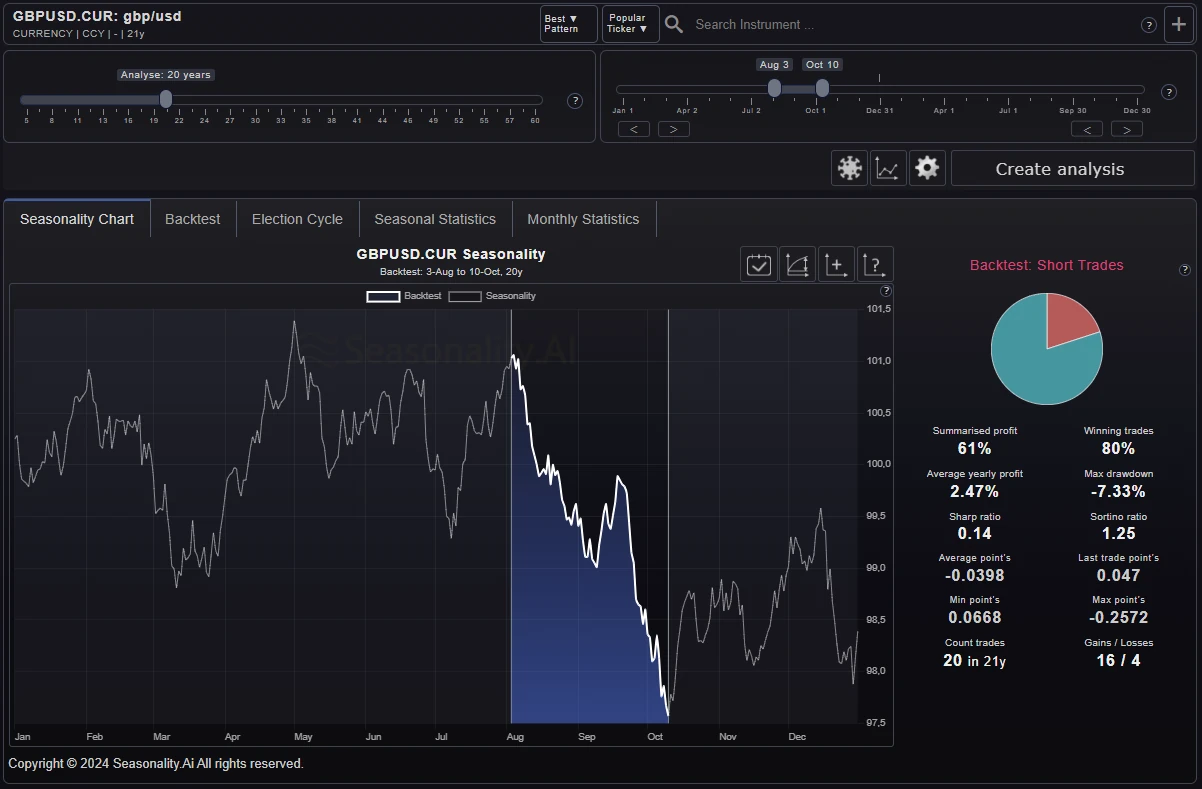
Seasonality in currencies: GBP/USD
The seasonal pattern of the GBP/USD currency pair shows a downward trend.
Our Seasonality analyzer automatically detects the downtrend and calculates the backtest with short trades.
The currency generates an average return of 2.89% for the selected period.
Our Seasonality analyzer automatically detects the downtrend and calculates the backtest with short trades.
The currency generates an average return of 2.89% for the selected period.
Our screener shows you the best seasonal patterns for currencies and cryptos.
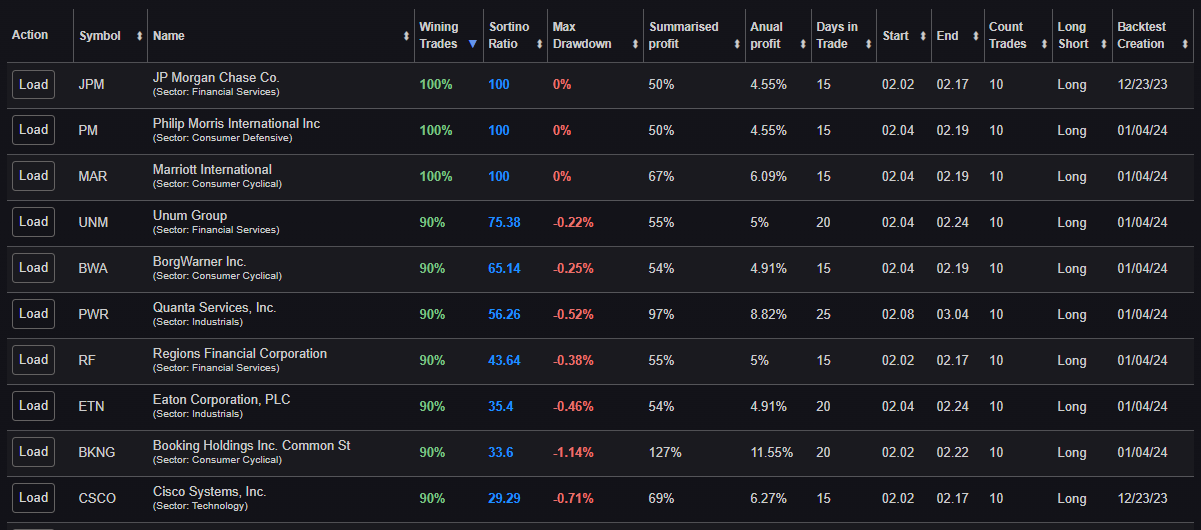
What is a seasonal screener?
The Seasonality Screener shows you the best recurring trends for Stocks, ETFs, Currencies (Forex), Cryptos, Commodities, and Futures. You can find profitable times to trade and invest with just a few clicks.
Our database contains hundreds of grand entry and exit points.
The Seasonality Screener is part of our Seasonal Essentials program, which includes two other powerful tools for analysing recurring price patterns.
The Seasonality Screener is part of our Seasonal Essentials program, which includes two other powerful tools for analysing recurring price patterns.
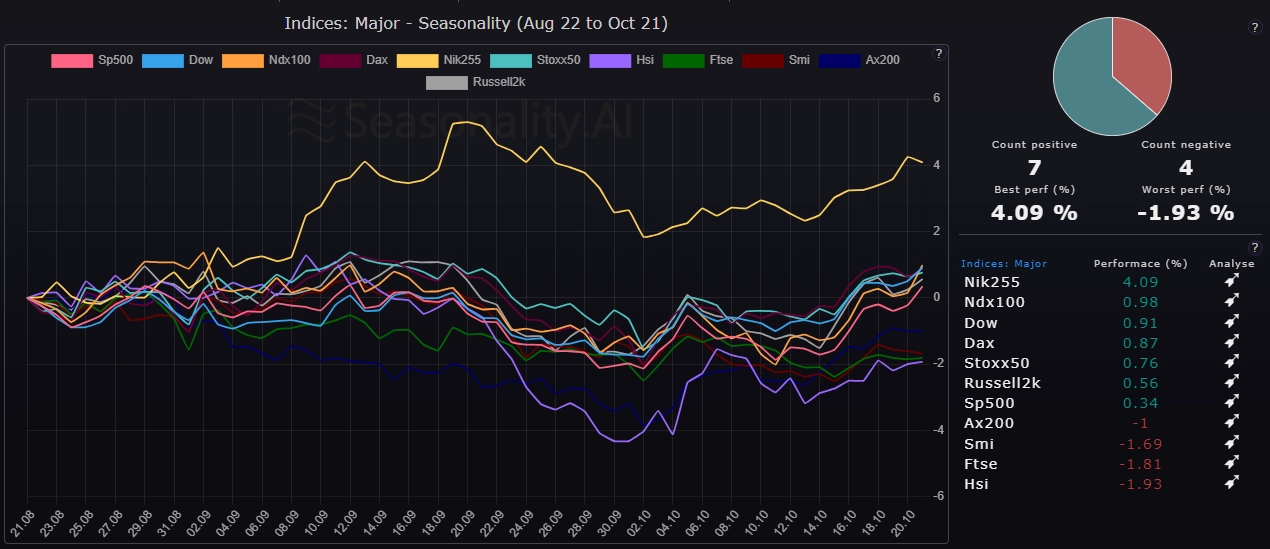
What is a seasonal comparison?
Finding the best always needs a comparison. Comparison is an integral part of any analysis process.
Compare the seasonal performance of various indices, sectors, commodities, financial futures, currencies, and cryptos.
Compare the seasonal performance of various indices, sectors, commodities, financial futures, currencies, and cryptos.

Seasonal Patterns: A Key to Success for Top Traders (Larry Williams)
Many of the world’s most successful traders and investors rely on seasonal patterns to optimize their trading strategies and achieve consistent profits.
Larry Williams, for example, is a standout name in the trading world.
In 1987, he won the prestigious Robbins Trading Cup, turning $10,000 into over $1.1 million within 12 months.
Williams emphasizes the importance of seasonality in his strategies and even developed the "True Seasonal Index" to identify recurring price movements in stocks and commodities.
Applying seasonal analysis enables traders to identify and capitalize on recurring market movements.
By understanding these patterns, traders can refine their entry and exit points, leading to more precise and effective trading strategies.
Larry Williams' remarkable success is a testament to how utilizing seasonal trends can drive significant profits in financial markets.

Seasonal Patterns: A Key to Success for Top Traders (Michael J. Huddleston)
Another prominent advocate of seasonality is Michael J. Huddleston, widely known as "The Inner Circle Trader" (ICT).
Huddleston has revolutionized the way traders approach the Forex market by highlighting how seasonal trends play a critical role in currency trading.
His concepts, embraced by traders worldwide, demonstrate the immense potential of leveraging seasonality to gain a competitive edge over other market participants.
Michael J. Huddleston, or ICT, also underscores the value of seasonality, particularly in the Forex market. By analyzing seasonal tendencies, traders can better anticipate market movements and position themselves for success, gaining a clear advantage over competitors.
Deep-dive Seasonality Analysis Tools
With our tools, you can create a seasonal chart, backtests, and statistics for every instrument.
Our screeners find the most stable seasonal patterns for your trading.
Our screeners find the most stable seasonal patterns for your trading.
Our Screeners
Get full access as a member!
Seasonality.ai
Identifying trading & investment opportunities has never been easier.