
smo-features
Event Essentials Features
If you have any suggestions for improvement or need to include functions in our tools, please feel free to send us an e-mail. We will carefully consider all requests.
Feature Highlights
- Backtests
- Fast screening
- Detailed comparisons
- Intraday (If available)
- Intuitive graphic display
- Many options and filters
We provide tools for optimal and fast event analysis.
Event Screener
Let our screener find the best opportunities for you!
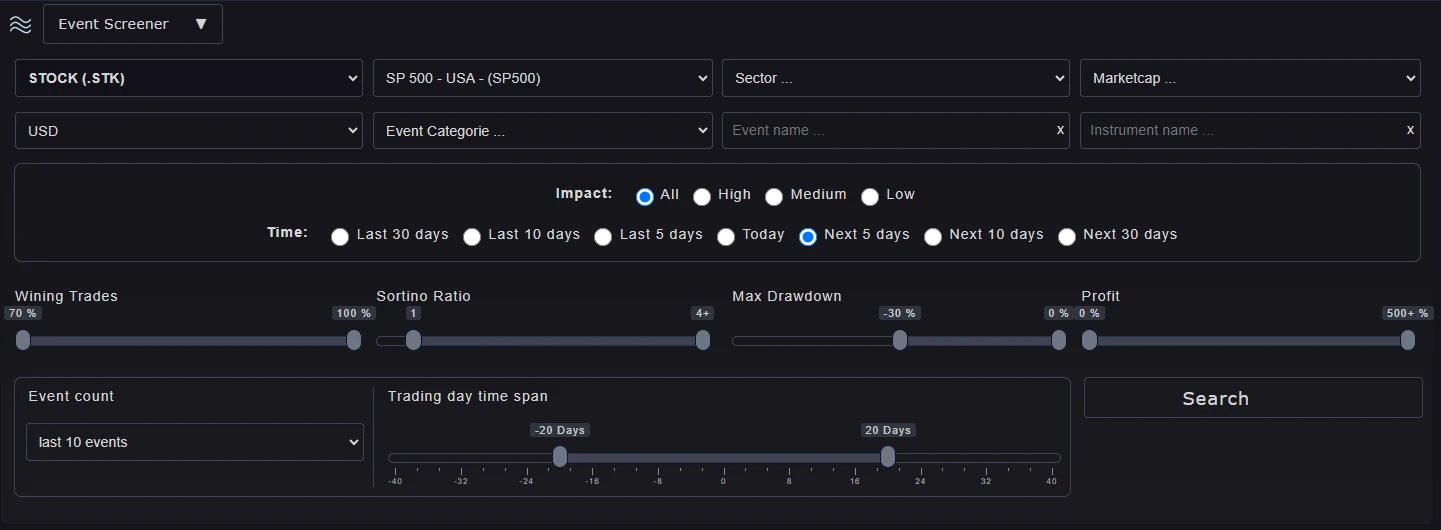
Our screener shows consistent price movement for recurring events from various financial markets. Each entry shows the results of a backtest. All relevant key figures of the backtest are displayed.
The power of the screener is that it offers you various filtering options.
Event Screener: Filter
Let our screener find the best opportunities for you! Identifying trading and investment opportunities has never been easier. Hundreds of Trade and Investment Opportunities are stored for You in our database.
The following filters are available:
- Instrument type: Stocks, ETFs, stock indices, futures (commodities), currencies, crypto
- Equity Index: Over 14 indices
- Stock sector: Over 13 sectors
- Event categories: Over nine categories
- Event: You can filter by individual events
- Instrument/Symbol: You can filter by unique symbols
- Currency: There are over two indices to choose from.
- Market capitalization: There are eight ranges to choose from.
- Event count: Number of events.
- Trade type: Pre or Post or All.

Event Screener: Filter and Results
All relevant key figures are available for the evaluation of the screener results.
You can filter all key figures of the screener results.
The following filters are available for key figures:
- Winning Trades
- Sortino Ratio
- Max Drawdown
- Days Per Trade: Count days per trade (Trade Duration).
- Annual Profit
Event Analyser
Quality is more important than quantity in a world with a lot of data.

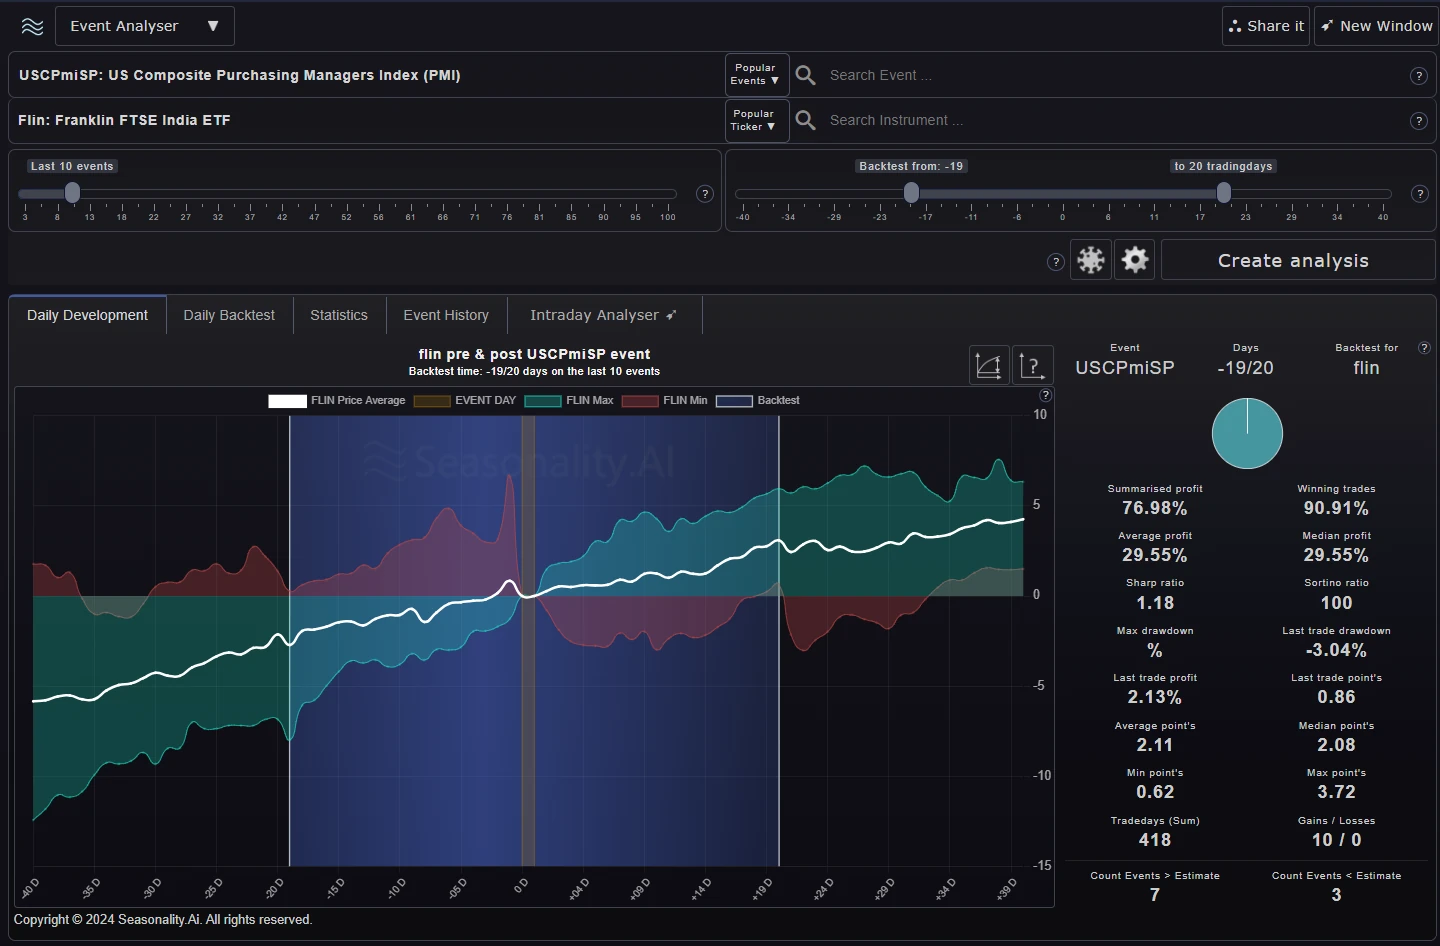
Event Analyser
The Event Analyser is a powerful analysis tool.
It enables the analysis of consistent price movement for recurring events with event charts, a backtest, and much more.
The Event Analyser shows you all the data from the event analysis. You can select the event and the instruments you wish to analyze in the upper section. There are many options available.
At the bottom, you will see the result of the event analysis.
At the bottom, you will see the result of the event analysis.

Event Analyser: Event Filter
You can filter the events based on their evolution.
With this filter, the analysis is only applied to the events that are not filtered out.
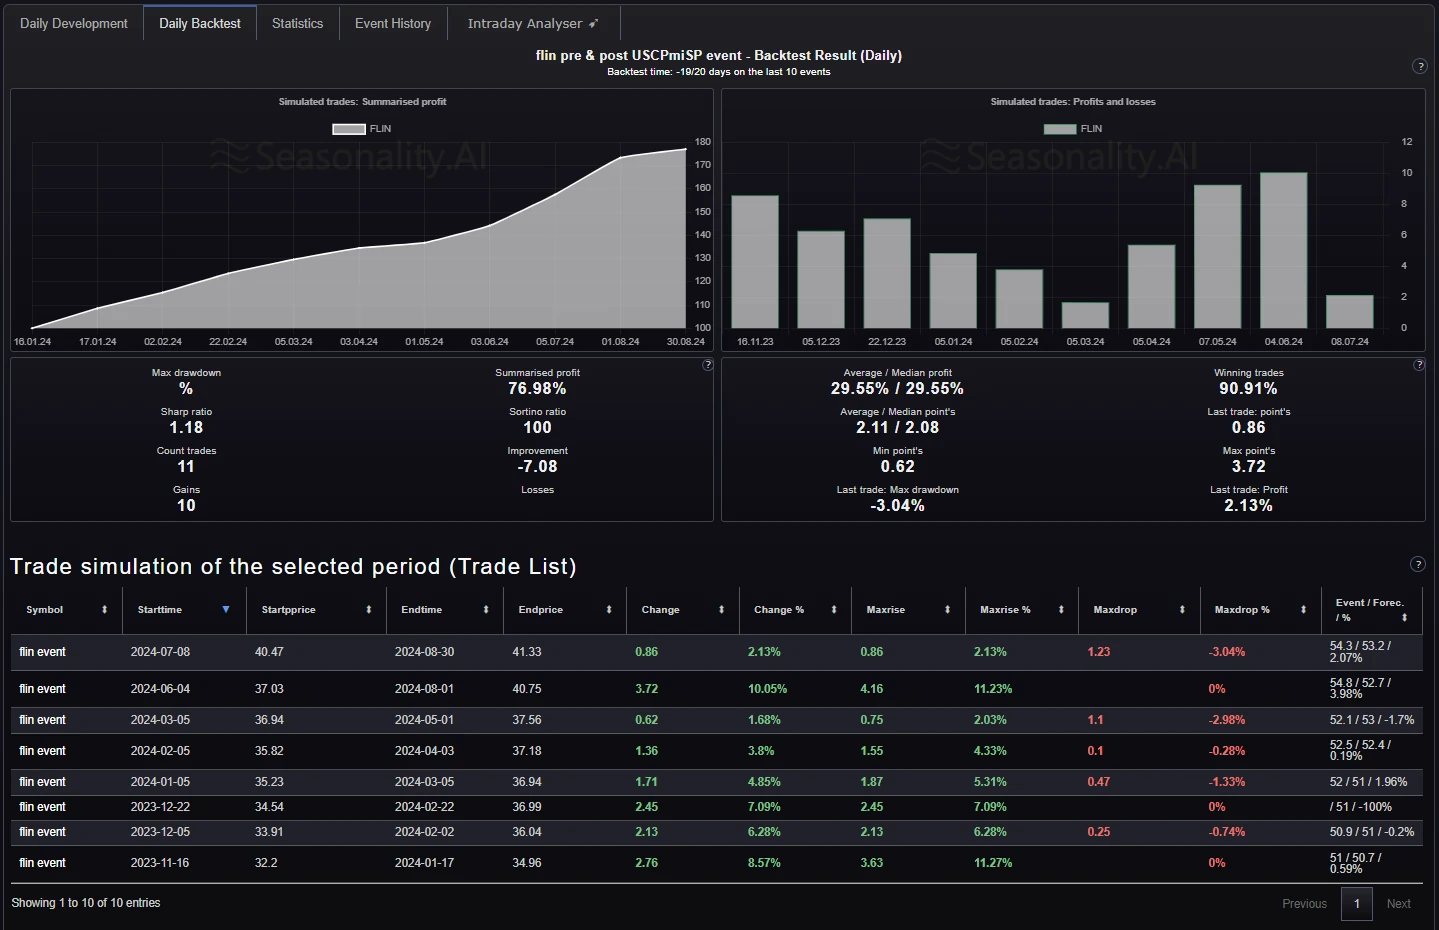
Event Analyser: Backtest Details
The backtesting of the event pattern is an essential part of the event analysis.
The backtest shows you two charts.
We show all the essential key figures in the overview for each backtest.
The table below shows each trade in the backtest.
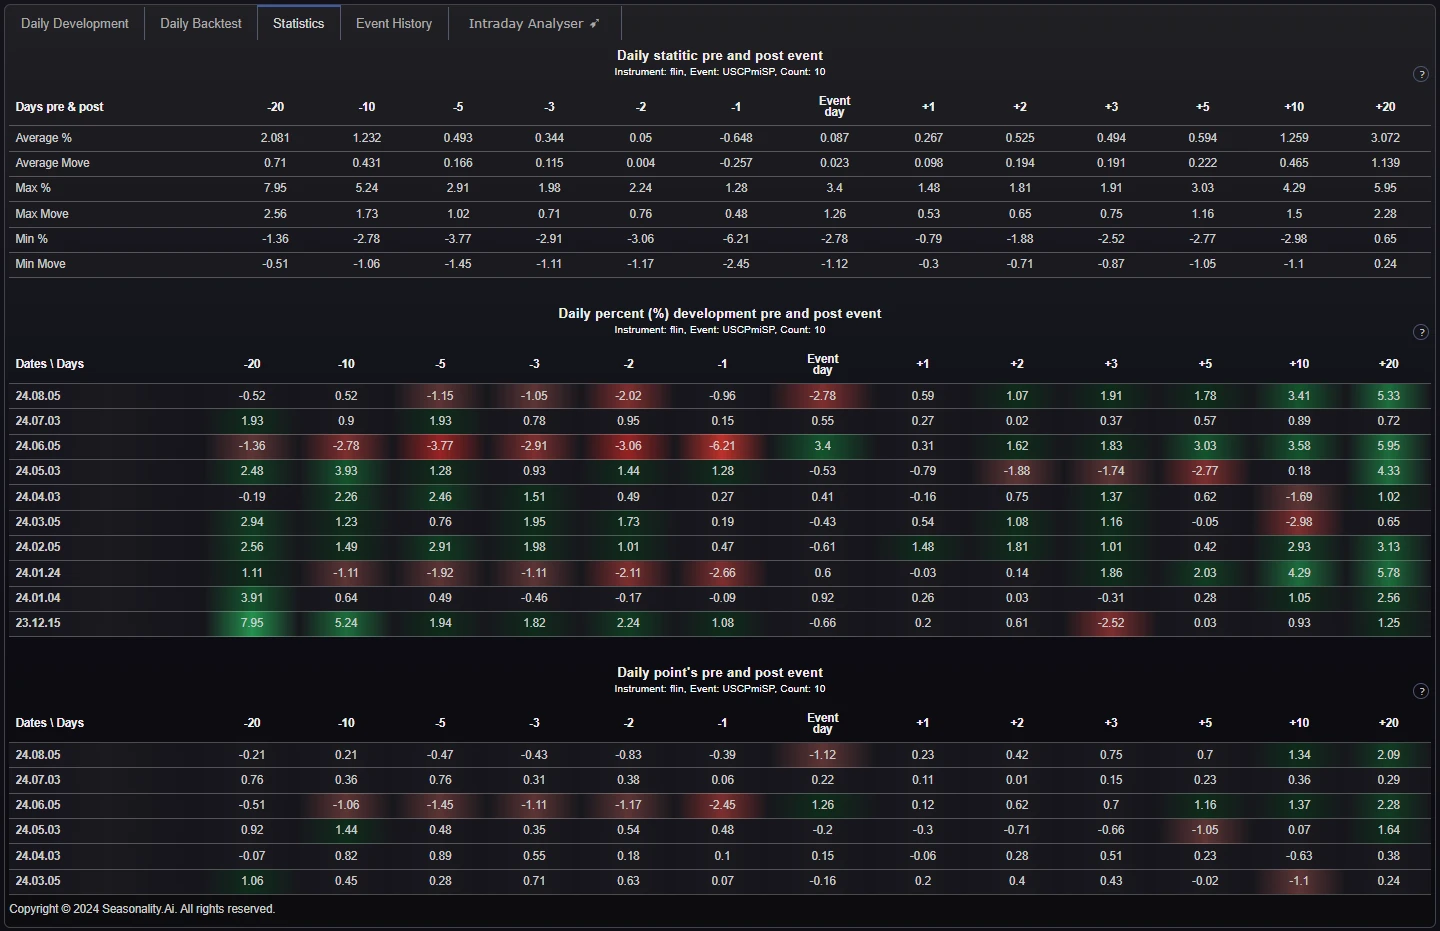
Event Analyser: Statistics
The statitcs shows the detailed development of the symbol. In addition, the green and red show the minimum and maximum development of the instrument during past events.
The statistics show the development of the instrument before and after the event. The data is displayed as min/max/averge data and in percent and points.
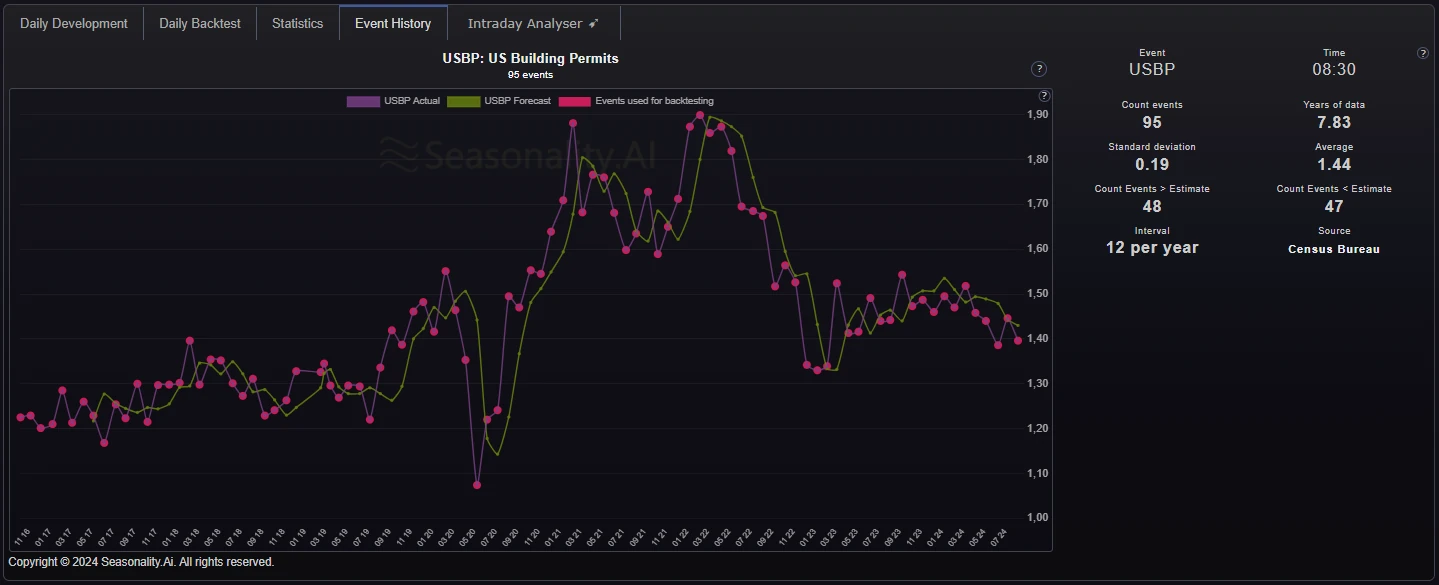
Event Analyser: Event History
The event chart shows the historical development of the event.
The blue circles on the event line indicate that the respective event was included in the analysis.
The blue circles on the event line indicate that the respective event was included in the analysis.
If we have forecast data available, we show it as well.
What should a practical analysis tool look like?
Relevant & insightful data
Many free analyses display 1-2 data series in a chart. This is usually helpful for a rough assessment of situations. But to make sustainable and profitable trading decisions, more insight is needed.
Content-rich data:
- Backtests show the "What would have been the profit if I had implemented the same action in the past?" scenario very well.
- Metrics quickly show the quality of the analysis's result.
- Data filter options allow you to recreate historical situations.
Speed & functionality
Time is a limiting factor for many private market participants. Most private individuals have a job, family, and hobbies. There is little time for extensive research and analysis.
Good analysis tools:
- Show relevant data quickly and clearly.
- Offer useful filters and configuration options.
- Offer powerful screeners.
- Offer comparative analysis of multiple instruments.
Quality is more important than quantity in a world with a lot of data.
Get full access as a member!
Seasonality.ai
Identifying trading & investment opportunities has never been easier.
