
Stock Market Seasonality Charts 2026
Stock Market Seasonality Charts are an excellent technique to optimize your timing for entry and exit.
Seasonality of Stock Market
Unlock the full potential of Recurring Price Patterns and combine our analysis software with our screeners.
BUT, Be Careful.
Looking at a simple seasonal chart is not enough!
You need a backtest and KPIs to see the quality of the seasonal pattern.
The quality of your analysis determines your success.
Seasonal Examples of the Stock Market
Would you like more Seasonality Stock Charts?
Our Seasonality Chart Analyzer offers free analyzable instruments.
You can access all instruments on our platform as a subscriber to our Seasonality Essential service.
1. SPY (SPX) SP500 ETF - Sell in May
The best-known seasonal pattern on the stock market is: "Sell in May and go away, but remember to come back in September!"
Prices rise much more from October to April than from May to September.
")
2. MSFT: Microsoft Seasonality Chart
Microsoft almost always publishes better results than forecast in Q3.
This creates a stable, recurring pattern with a high hit rate from which you can profit.
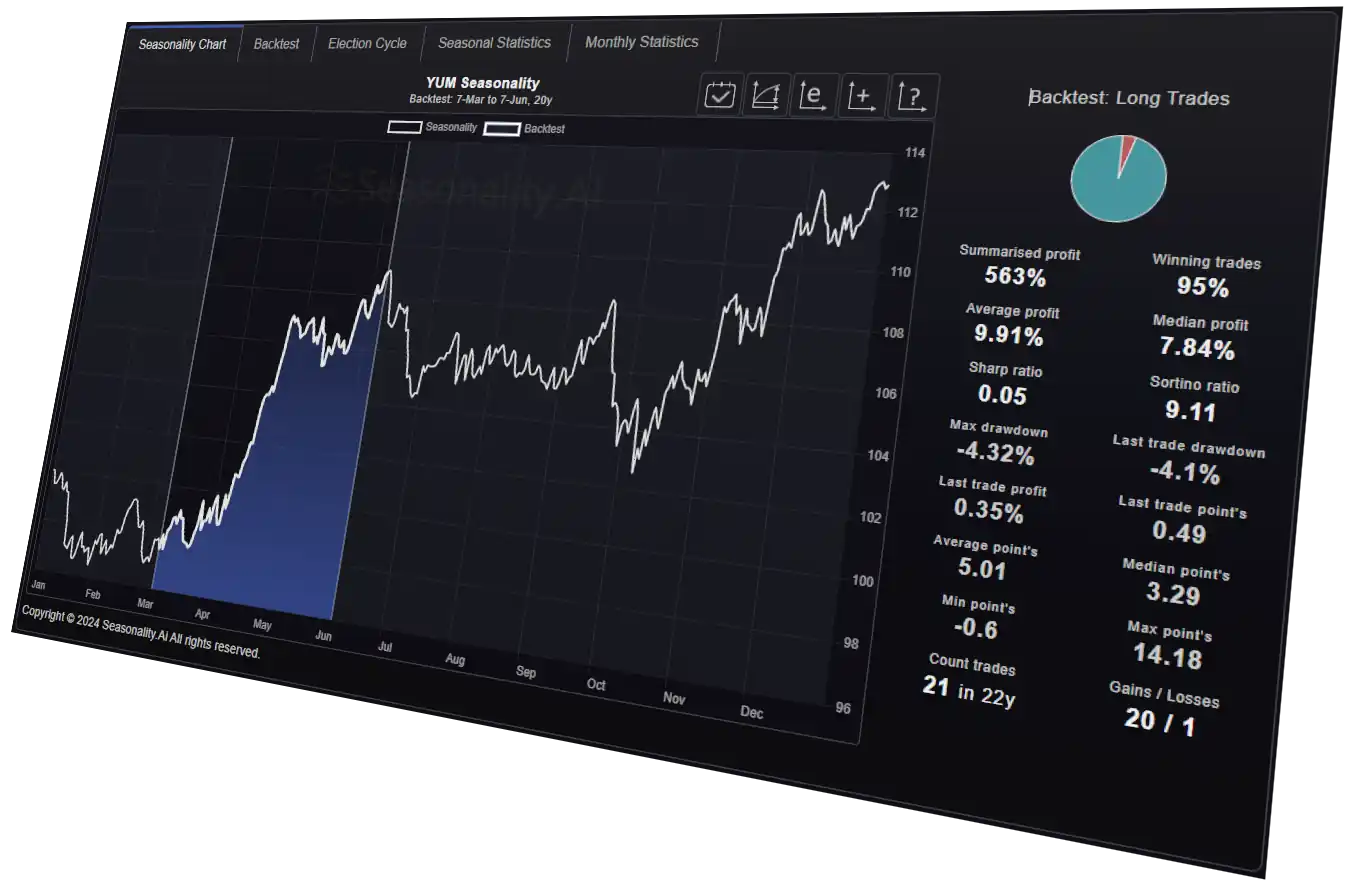
3. YUM: YUM BRANDS
YUM! Brands, Inc. is the world's largest operator of quick-service restaurants.
Regularly, the share price rises for three months from the beginning of March.
The hit rate of this seasonal pattern is over 95%. The Sortino Ratio is very high, suggesting a high and consistent performance.

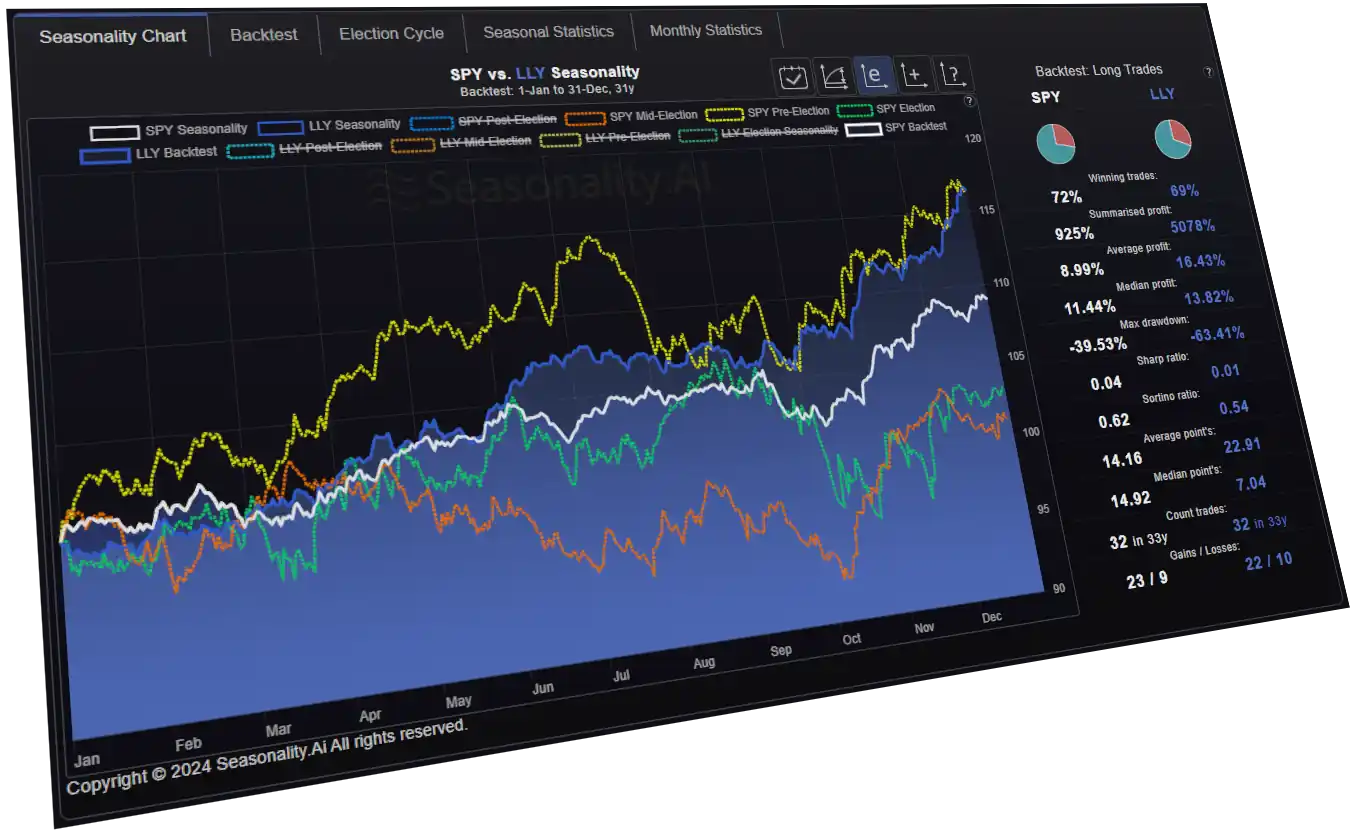
4. LLY vs UNH: Seasonal Chart of Eli Lilly (LLY)
The seasonal chart of Eli Lilly and Company is solid in the last two months of the year.
TFavorable corporate earnings regularly generate price increases.
The positive seasonal pattern can also be found across the healthcare sector.
Let's look at some examples.
But there are many more promising opportunities.
""Sell in May and go away, but remember to come back in September!""
The following chart shows the different performance of the SP500 over the last 70 years if it had been bought or sold in May.
Prices rise much more from October to April than from May to the end of September.

The chart shows the seasonal performance of gold, silver, copper, palladium, and platinum.
These precious metals rise the most in the first weeks of the year compared to the rest of the year.

The hit rate is excellent. Only in 2003 and 2012 was there a significant loss. In all other years, the share price rose.
On 11 occasions, the share price rose by more than 10%.

In this example, it is clear that the Eli Lilly share has a better hit rate (over 95%).
Comparisons are an essential part of any analysis.

The monthly pattern shows that in the second half of the month, the TLT ETF has gained 183.41% over the past 20 years.
This is equivalent to an average annual return of 9.17%.

The screener offers numerous filters that you can customise to suit your needs.
Get the best entry and exit signals with just a few clicks.

This gives you a clear overview and lets you focus on your preferred asset class.

This data helps to identify good recurring price patterns.
You can easily identify which index, sector, asset class, currency or commodity has performed best or worst.

Recurring, seasonal trends yield the same gains in a few weeks as typical investments do in a year.
The quality of your analysis determines your success.
You need a backtest to see if the recurring pattern has produced stable profits in each period and what drawdown has occurred.
Other statistical key figures and charts show qualitative monthly, weekly, and weekday performance details.
We show seasonal intraday charts for instruments with high trading volume for optimal buying time.
To use seasonality profitably, you need more than just a seasonality chart.
Our Seasonality Chart Analyzer shows you all the relevant data for your analyses and success.

Use the best seasonal patterns for your success.
Professional analysis tools for your success
All three Seasonality tools are part of the Seasonality Essential subscriber offer.
Why is there a Seasonal Pattern in Stocks?
If you're looking for an investment strategy that will help you beat the market year after year, there's no better place to start than with seasonal investing. Seasonal investing is based on the idea that specific industries do better during certain times of the year. For example, the housing industry performs better in the spring and summer because more people buy homes.
There are many studies where the seasonal effect is well described. You can find a list of studies in the following post: What Is Seasonality? How It Works.
Stock, currency, and commodity price developments result from economic or corporate developments. These developments repeat themselves and automatically generate recurring (seasonal) patterns. Weather-related reasons also influence the demand for commodities or products.

When Should You Buy and Sell Stocks?
There are two main reasons why you should consider seasonal investing. First, it helps you avoid making costly mistakes by avoiding investments that could be performing better. Second, it allows you to make money when others are losing money.
Identifying the opportune moments to buy and sell stocks can be a complex task. However, leveraging seasonal effects, a strategy long recognized in the financial industry, can simplify this process. By utilizing the right platform, you can efficiently search for opportunities and conduct thorough analyses.
Which Months are Best for Buying and Selling Stocks?

If you want to invest in shares, there are different aspects from a seasonal perspective.
In general, the overall seasonal trend of the share index has a positive effect on the seasonal trends of individual shares.
The last few months of the year produce the best performance.
However, there are numerous examples of shares performing better in other periods than at the end of the year.
What happens to the Stock Market During the Summer?
While the stock market tends to do well in the spring and fall, it tends to do worse in the summer. Why? Because people spend more time outdoors and less time inside watching TV and playing video games. As a result, fewer people buy new products and services, so businesses are making less money.
Seasonality can improve the timing of their investment and trading activities. Analyze strong recurring trends and find the best opportunities with our Seasonality Screener.
Create your seasonal stock charts for all 20000 stock tickers in our database.
Effective Analysis
Recurring price patterns:
- Seasonal price patterns
- Seasonal intraday price patterns
- Portfolio Strategy Builder
- Ex-Dividend days price patterns
- Earnings release price patterns
- Economic event price patterns
Expanding on Stock Market Seasonality
Understanding Advanced Seasonal Patterns
As we delve deeper into the analysis of stock market seasonality, it's crucial to recognize that advanced seasonal patterns can offer even more precise insights. These patterns go beyond the basic monthly or quarterly trends and examine specific days, weeks, or even hours within a trading period. By leveraging historical data, traders can identify high-probability periods for specific market movements.

Utilizing Technology for Enhanced Analysis
Modern trading platforms and tools, such as those offered by Seasonality.ai, allow for sophisticated analysis of seasonal patterns. These tools enable traders to:
- Analyze Intraday Patterns: Understand how stock prices behave at different times of the day.
- Compare Seasonal Trends: Compare historical performance across different assets to find the most reliable patterns.
- Automate Strategy Development: Use algorithmic trading to develop and backtest strategies based on identified seasonal trends.
Benefits of Seasonal Trading
Incorporating seasonality into your trading strategy can significantly enhance your trading performance by:
- Identifying Optimal Entry and Exit Points: Seasonal patterns help pinpoint the best times to enter or exit trades, reducing the risk and maximizing returns.
- Improving Risk Management: Understanding seasonal trends can help in forecasting market volatility and adjusting trading strategies accordingly.
- Enhancing Portfolio Diversification: By recognizing patterns in various asset classes, traders can diversify their portfolios more effectively.

Practical Application
To put these insights into practice:
- Regularly Review Historical Data: Keep an updated database of historical price movements and analyze them frequently to detect new or evolving patterns.
- Integrate with Other Analysis Techniques: Combine seasonal analysis with technical and fundamental analysis for a more comprehensive trading approach.
- Stay Updated with Market News: Seasonal patterns can be influenced by current events, economic reports, and other market news. Staying informed ensures that your seasonal analysis remains relevant.
Why a Seasonal Chart Alone Is Not Enough for Successful Trading
The Limitations of Seasonal Charts
A seasonal chart is an excellent starting point for identifying recurring patterns in the stock market. It visualizes historical price trends over specific time frames, making it easy to spot patterns that repeat year after year. However, relying solely on a seasonal chart can be risky and incomplete. A seasonal chart lacks the depth required for actionable insights and effective decision-making.
Seasonal charts provide a snapshot of historical averages but do not account for variables like volatility, probability, and market changes. This is where tools like backtesting and seasonal screeners become essential for a comprehensive analysis.


The Role of Backtesting in Seasonal Trading
Backtesting is the process of testing a trading strategy against historical data to determine its performance and reliability. For seasonal trading, backtesting allows traders to validate whether a recurring pattern is statistically significant and worth trading.
Without backtesting, a seasonal chart may appear promising but could be misleading. Backtesting provides key metrics such as:
- Win Rate: The percentage of trades that were profitable.
- Average Return: The expected gain or loss for a given pattern.
- Drawdown: The maximum loss experienced during the strategy’s performance period.
At Seasonality.ai, our platform includes advanced backtesting tools that help traders understand the true potential of seasonal patterns before risking real capital.
Why a Seasonal Screener Is Essential
Another critical component of successful seasonal trading is a seasonal screener. While a chart shows historical averages, a screener identifies the most promising opportunities based on predefined criteria. For example:
- Find stocks or instruments with the highest seasonal returns.
- Filter results by volatility, time frame, or market conditions.
- Identify trades that align with your portfolio goals.
The Seasonality.ai Screener is designed to save you time by pinpointing the best opportunities in seconds, allowing you to focus on execution rather than exhaustive research.

The Winning Formula: Chart + Backtest + Screener
To achieve consistent success in seasonal trading, you need more than just a chart. Combining a seasonal chart with backtesting and a screener gives you:
- Confidence: Backtesting validates the reliability of patterns, ensuring you're trading with a proven strategy.
- Efficiency: A screener quickly identifies high-potential trades, saving hours of research.
- Precision: A holistic approach minimizes guesswork and maximizes your chances of success.
With the right tools, seasonal trading becomes a science, not a gamble.
Start Leveraging Advanced Seasonal Tools Today
Don’t let incomplete data hold you back. Elevate your trading game with the powerful tools available at Seasonality.ai. Use our backtesting and screener features to unlock the full potential of seasonal patterns and achieve more consistent, reliable results.
Join thousands of traders who have already taken their strategies to the next level. Explore our platform and see the difference for yourself!
Conclusion
By expanding your understanding of stock market seasonality and utilizing advanced tools, you can uncover hidden opportunities and enhance your trading strategies. Seasonality.ai provides the resources needed to explore these patterns deeply, ensuring you stay ahead in the competitive world of trading.
For more detailed insights and to start leveraging advanced seasonal analysis, explore our comprehensive tools and resources at Seasonality.ai.
Get full access as a member!
Seasonality.ai
Identifying trading & investment opportunities has never been easier.